Track the evolution of major financial and economic events
Gold prices advanced to a new high since June on August 21, fueled by renewed selling pressure on the US Dollar. The upward movement was supported by fading market expectations regarding further Federal Reserve interest rate hikes. As a non-yielding asset, gold became more attractive to investors as bets on higher rates diminished.
Russia's Orsk oil refinery has shut down completely for up to six months following a Ukrainian drone strike on August 13. The offensive expanded to include strikes on the Ust-Luga port, Savasleyka air base, and the Progress Rocket and Space Center using specialized cruise missiles. President Zelensky noted that these actions target Russia's military and space potential, including electronics vital for war operations. This series of attacks marks a significant disruption to Russia's strategic energy and industrial infrastructure.
The closure of the Strait of Hormuz due to Iranian attacks has isolated major LPG exporters, including Saudi Arabia, the UAE, and Qatar, disrupting global supply chains. Geopolitical tensions escalated further following a Houthi attack on Saudi Arabia, pushing Brent crude prices above $83 per barrel. Meanwhile, the cryptocurrency market saw Bitcoin rise significantly from $63,000 to stabilize just below the $68,000 level. These events represent a sharp escalation in Middle East tensions, contradicting previous reports of improving regional sentiment.
Oil prices declined significantly following reports of an imminent deal to reopen the Strait of Hormuz. On August 4, Brent crude dropped 4% after comments regarding a temporary shipping arrangement agreed upon by negotiators from Iran and Oman. By August 5, WTI oil tested the $75 level as market participants focused on the ongoing negotiations between the two nations.
Silver (XAG/USD) reached the $59.00 level on August 4, driven by cautious optimism regarding peace efforts in Iran. By August 5, the price surged further to revisit monthly highs near $61.00. This upward movement in silver prices coincided with a significant decline in global oil prices as markets weigh geopolitical developments against precious metal forecasts.
Gold has broken through key technical resistance levels, strengthening near-term bullish expectations. Confirming broader momentum requires a move above $4,203 and the 50-day moving average. As prices hold above current support, gold faces a key test of its reversal setup; a breakout above the $4,203–$4,240 resistance range could confirm a broader bullish trend reversal.
Oil prices jumped 3% on Monday, with Brent crude surpassing $90 a barrel. The surge follows expanded attacks between the US and Iran, which have curbed energy shipments through the Strait of Hormuz. These developments highlight how escalating geopolitical tensions are directly impacting global energy flows.
Gold prices rose in early Asian trade, supported by sustained structural demand from central banks, though they remained below the $4,000 mark. While a modest pullback in the US dollar provided some stability, the near-term outlook remains bearish due to elevated bond yields across major economies. Additionally, billionaire John Paulson consolidated ownership of the Donlin Gold mine through a significant $4.2 billion deal with NOVAGOLD.
WTI crude oil is testing key technical resistance levels following a powerful 13-day consecutive rally and recovery phase. Prices are currently oscillating between a support level of $77.84 and a resistance level of $81.25, with buyers eyeing a breakout toward the 50% Fibonacci retracement at $82.01. The market is also monitoring the 100-hour moving average at $79.17, as a break below this level could shift the technical focus back to the $77.84 support mark.
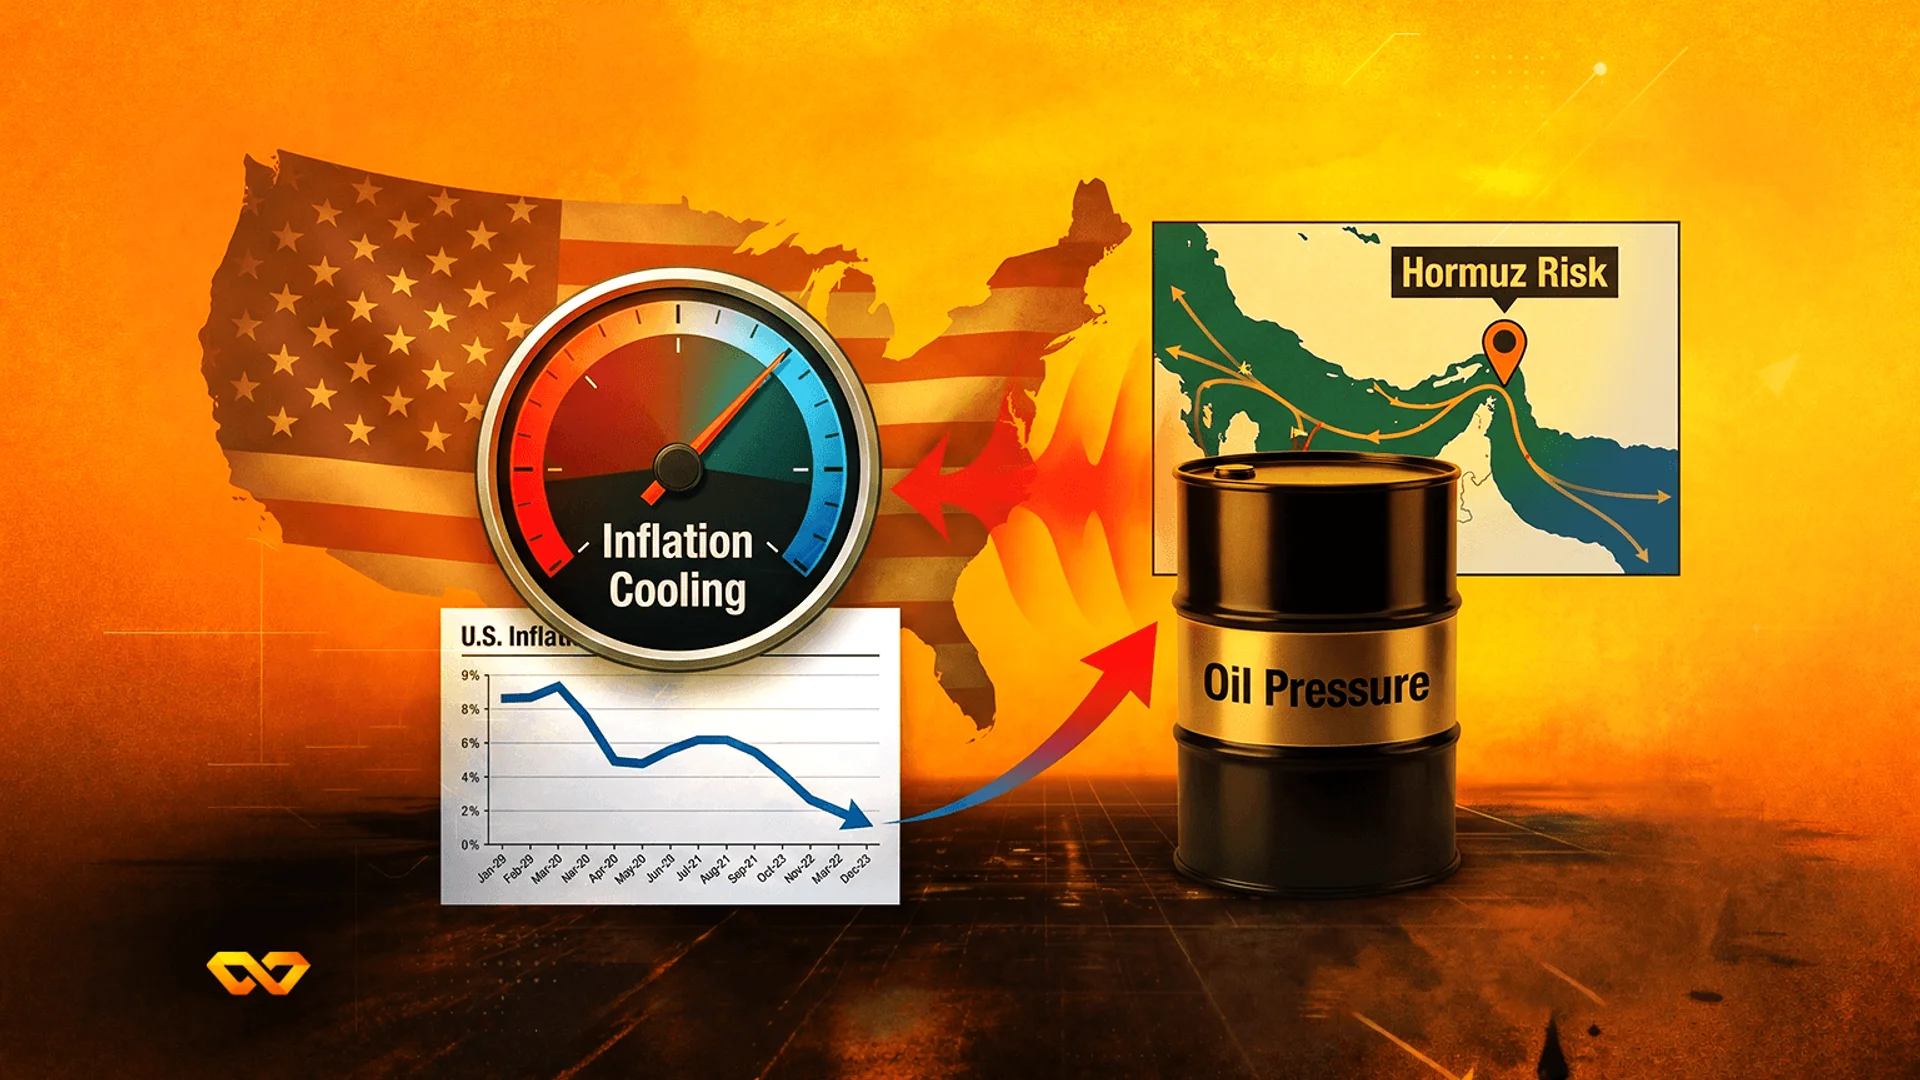
Asian spot LNG prices surged 10% to $20.2 per mmBtu, while US gas prices topped $4 due to shipping disruptions in the Strait of Hormuz. Oil prices rose sharply amid renewed Middle East conflict, complicating the economic outlook despite cooler-than-expected US inflation data. While soft CPI and PPI data eased immediate Federal Reserve rate-hike fears and lowered bond yields, markets remain wary of rising energy costs.
Gold price (XAU/USD) remains under bearish momentum as it stays below the 20-day EMA. Analysts suggest further downside potential if the price breaks the technical support level of $3,940. As of July 20, the price is approaching the tip of a technical triangle formation near the $4,000 area.
Silver prices (XAG/USD) fell toward the $57.00 level on July 16, driven by ongoing geopolitical tensions in the Middle East. By July 20, spot silver rose 1.8% to $56.85 an ounce but faced strong resistance at the $57.50 level. Prices were further influenced by Brent crude climbing above $90 a barrel as the US-Iran conflict neared a broader regional war.
China's crude oil imports plunged 41.3% in June to their lowest level since 2016, effectively capping global price hikes despite Middle East supply disruptions. However, imports are expected to recover in July to an average of 7.8 million barrels per day. This projected surge is driven by increased refinery purchases of Russian crude and a higher volume of tanker arrivals from the Middle East.
Gold prices declined early in the week due to a stronger US dollar and high interest rates, further pressured by the emergence of a technical 'Death Cross' pattern. Despite a slight bounce and attempts to hold support levels on Friday, gold ended the week down 2.5%. This performance marks the second consecutive weekly decline for the precious metal.
Gold prices recovered to trade above $4,100 on July 10 as traders assessed US-Iran geopolitical risks. By July 15, the market consolidated above $4,000 an ounce despite failing to break through resistance at $4,100. However, gold fell below the $4,000 level on July 17, marking its first daily close below this threshold since November 2025.
Crude oil prices rose following U.S. attacks in the Middle East, causing Asia-Pacific government bonds to fall amid inflation concerns. On July 13, international prices surged nearly 10%, marking the largest single-day increase since 2020, following President Trump's announcement to reimpose a U.S. blockade. This policy shift caused market sentiment to pivot toward a long-term expectation that operations in the Strait of Hormuz will not return to normal.
On July 8, at least four oil and LNG tankers made U-turns from the Strait of Hormuz following Iranian attacks on three commercial ships. These attacks prompted operators to pause transit attempts. On July 9, Stolt-Nielsen reported mixed financial results for the second quarter of 2026, with the company's operations impacted by ongoing disruptions in the Strait of Hormuz.
Oil and natural gas prices maintained key technical support levels throughout July, driven by resilient demand and elevated refinery activity. WTI and Brent crude consistently defended higher support levels, reaching $79.57 and $84.76 respectively by July 14. Meanwhile, natural gas sustained its upward channel structure despite price fluctuations, as U.S. crude inventories remained near minimum operating levels due to firm demand for refined products.
Gold prices initially declined due to uncertainty over Federal Reserve policy decisions before stabilizing as investors awaited meeting minutes. While geopolitical risks in Iran supported gold's safe-haven appeal, prices later leveled off following a rally driven by inflation data. However, Fed official Christopher Waller expressed reservations regarding the anticipated pace of future interest rate cuts.
The U.S. Strategic Petroleum Reserve (SPR) saw a consistent decline in crude oil stocks throughout July, starting with a 6.2 million barrel drop to 319.5 million barrels, the lowest level since April 1983. This downward trend continued in the following weeks with additional decreases of 3 million and 5.1 million barrels. By July 20, total stocks reached 311.4 million barrels, marking a significant reduction in the nation's strategic reserves.
Silver prices (XAGUSD) experienced fluctuations in July driven by shifting interest rate expectations. On July 6, the outlook improved as a weak jobs report lowered the odds of a rate hike. However, by July 14, silver prices declined as surging oil prices increased the probability of further interest rate hikes by the Federal Reserve.
On July 6, OPEC+ agreed to further increase its oil output targets starting from August. On the same day, exports via the Strait of Hormuz began to recover, potentially contributing to global supplies. On July 7, the extension of production increases was confirmed as Gulf oil flows recovered and prices cooled.
Traders are watching the Federal Reserve minutes on July 5 to see if gold can break above its 52-week moving average. Gold prices experienced noisy trading on July 9 as market participants monitored interest rate markets and the US dollar. Technical analysis indicates a looming 'Death Cross' formation, signaling potential downside risks for gold.
Wood Mackenzie analysts predict the end of cheap U.S. natural gas by 2035, driven by AI data center demand and LNG export expansion. Despite this long-term outlook, futures prices declined in mid-July due to larger-than-expected inventory builds and cooler weather forecasts. Additionally, planned maintenance at the Freeport LNG facility is expected to reduce both demand and export volumes.