
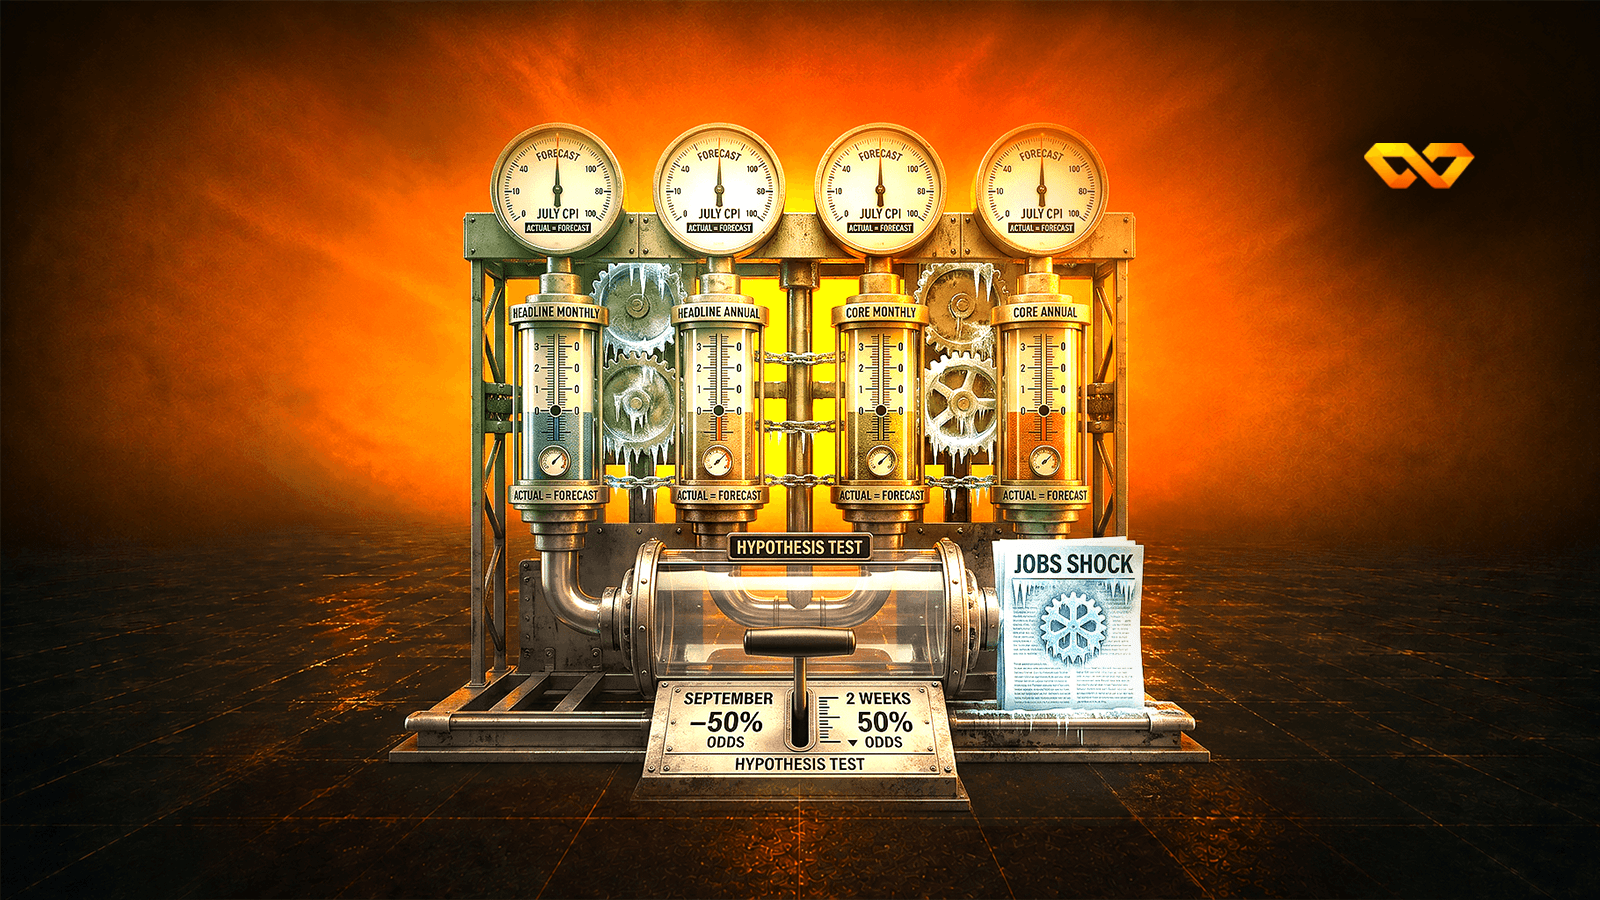
Four figures with no deviation, a freezing labour market, and September hike odds halved in two weeks.
The July 2026 reading of the Consumer Price Index (Consumer Price Index, CPI), released today, Wednesday 12 August, matched expectations across all four components: +0.1% month-on-month and 3.4% year-on-year for the headline index, and +0.2% monthly and 2.5% annually for core inflation (Core Inflation) — the measure excluding food and energy. Both annual rates slowed by one-tenth of a percentage point from June, and the surprise was the absence of one: zero deviation from consensus across all four readings.
The reading carries a rare inversion: core inflation (2.5%) sits below headline inflation (3.4%) — because the energy shock resulting from the war with Iran is lifting the annual figure (gasoline +24.6% year-on-year), while prices outside energy remained subdued. Read alongside last week’s Nonfarm Payrolls (Nonfarm Payrolls, NFP) report, which recorded −23 thousand, the picture of the Federal Reserve’s inverted dilemma is complete: a freezing labour market and headline inflation still above target, in a cycle where officials are debating raising rates, not cutting them. September hike odds fell from 67% on 31 July to 44.4% after the jobs shock, then to around 38–42% after today’s reading — a reading that weakened the case for a hike but did not bury it entirely.
Our preview published yesterday withstood the test: the consensus figures we cited were realised exactly across the four components, the Cleveland Federal Reserve’s Nowcast (Nowcast) was almost faultless, and the decision rule we published (“core ≤0.2% buries the hike”) was directionally validated — with one caveat explained in the record-correction paragraph below, alongside two corrections to figures we previously published.
This part of the paper is open to EL7 Pro members and to free members who use one of this month's free papers on it. The paper goes on to analyse the numbers, the causes and what they mean for investors, with tables, charts and sources.
This part of the paper is open to EL7 Pro members and to free members who use one of this month's free papers on it. The paper goes on to analyse the numbers, the causes and what they mean for investors, with tables, charts and sources.
This part of the paper is open to EL7 Pro members and to free members who use one of this month's free papers on it. The paper goes on to analyse the numbers, the causes and what they mean for investors, with tables, charts and sources.
A free account gives you 4 full research papers every month. Or subscribe to EL7 Pro for full access to more than 300 papers.
$700 per year · or $99 per month