
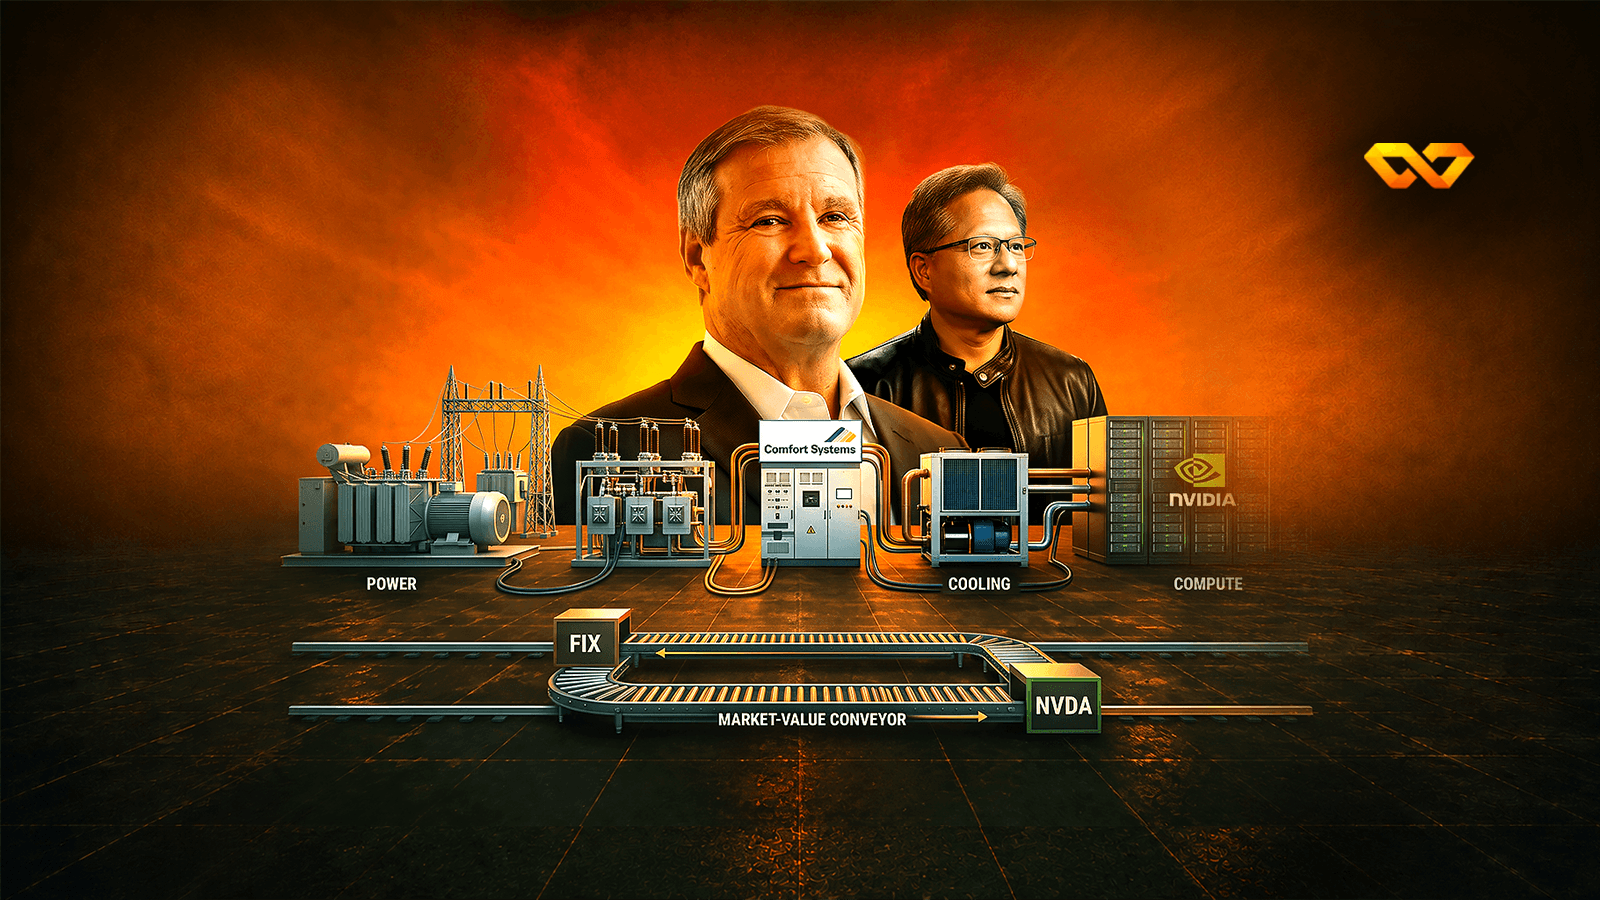
Electricity flows from the generator to the server hall. The market, however, pays in almost the opposite direction; this report measures the gap between the two ends using a single automated criterion.
The flow of electricity in any computing facility runs in one direction: from generation to transmission to the substation and then to the server hall. The market, however, pays in almost the opposite direction.
We measured 12-month returns for three groups of listed US companies, classified using one automated criterion: how the company gets paid. The result showed a gap of 51 percentage points between the two ends of the same chain.
| Group | Number | Median return for 12 months | Worst | Best | Companies with negative returns |
|---|---|---|---|---|---|
| A · paid on completion | 34 | +45.8% | −38.1% | +472.4% | 6 of 34 |
| B · paid per megawatt | 8 | −5.2% | −29.3% | +28.9% | 5 of 8 |
| C · tariff-regulated | 26 | +5.2% | −15.0% | +26.1% | 8 of 26 |
Measurement date: 10 August 2026 close versus 8 August 2025 close, comparing closing prices.
Five findings summarise this report:
What this report does not say: We do not claim that Group A will continue to outperform, or that Group B's decline is solely due to data-centre policies. The six exceptions in Group A and the three in Group B are named in the final section; they are not concealed.

Median 12-month return for each station • Close 10 August 2026 versus 8 August 2025
This part of the paper is open to EL7 Pro members and to free members who use one of this month's free papers on it. The paper goes on to analyse the numbers, the causes and what they mean for investors, with tables, charts and sources.
This part of the paper is open to EL7 Pro members and to free members who use one of this month's free papers on it. The paper goes on to analyse the numbers, the causes and what they mean for investors, with tables, charts and sources.
This part of the paper is open to EL7 Pro members and to free members who use one of this month's free papers on it. The paper goes on to analyse the numbers, the causes and what they mean for investors, with tables, charts and sources.
A free account gives you 4 full research papers every month. Or subscribe to EL7 Pro for full access to more than 300 papers.
$700 per year · or $99 per month