
...
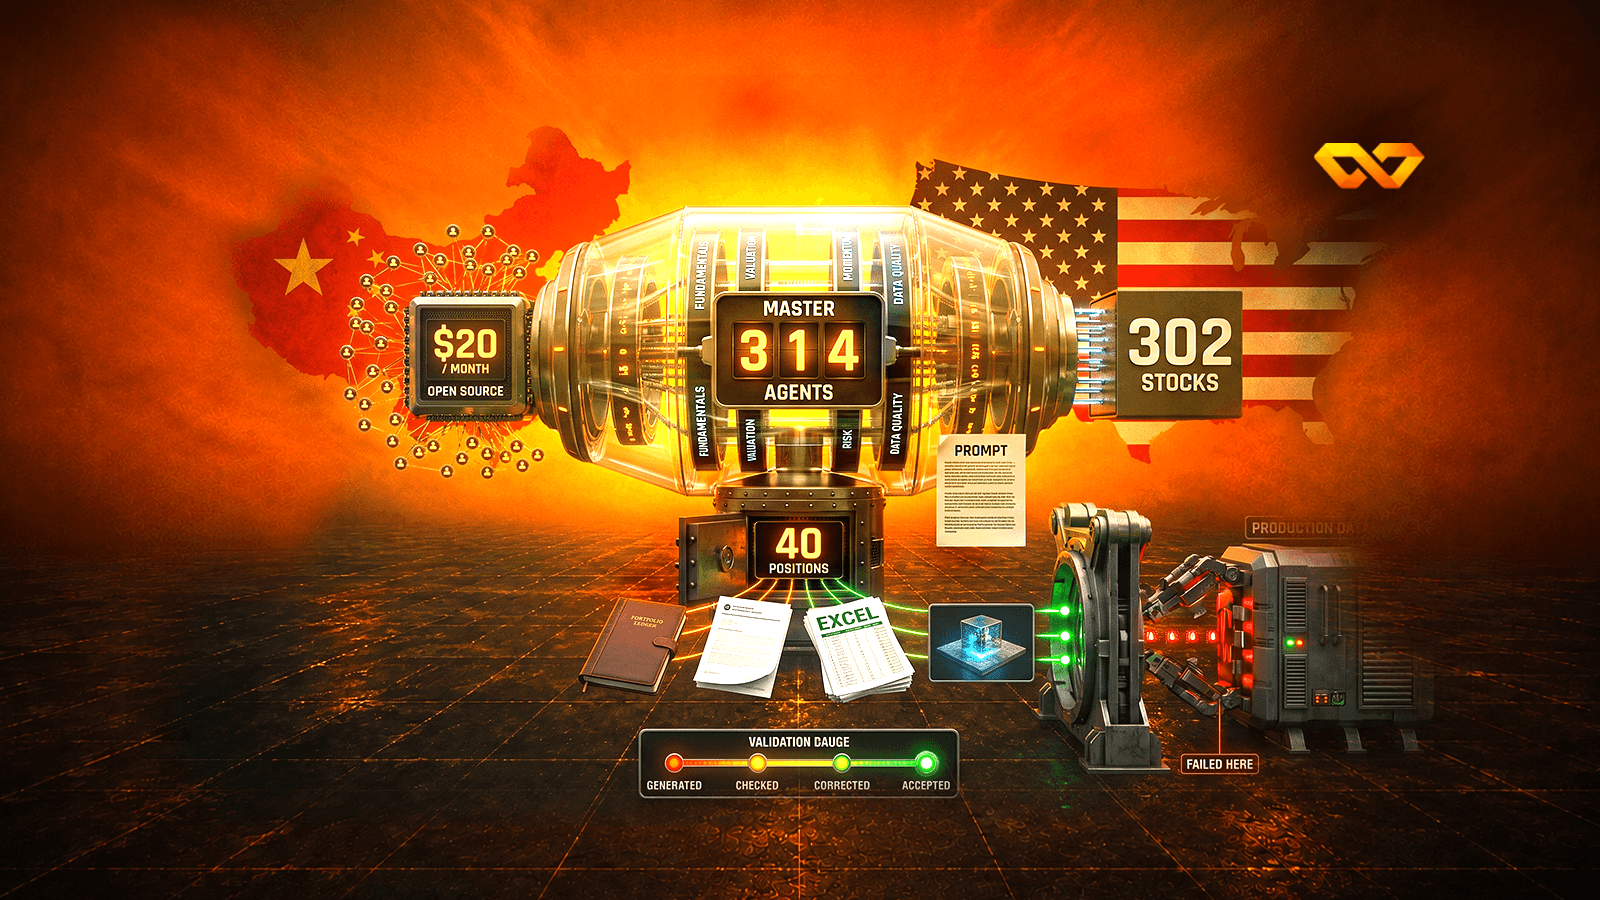
We ran a swarm of 314 agents inside a Chinese open-source model. It screened 302 U.S. stocks, produced a 40-position portfolio, an institutional-style report, Excel workbooks and interactive 3D scenes — on a subscription that costs under twenty dollars a month. Then we did the thing nobody does: we audited every number it produced against our production database. This is the complete guide — the architecture, the prompt you can download and run today, what worked, and more importantly: exactly where it broke, and why.
An agent swarm is good at structure and bad at verification. The shape it produced — sectors, then stocks, then an allocation committee — is exactly how a real research desk is sequenced, and the quality bias it claimed was real and measurable: the portfolio sits in the 78.5th percentile on the quality axis of our factor engine. But the data layer underneath it was brittle: 77 of 302 research notes explicitly admit that their data fetch failed — and then issue a numeric verdict anyway.
The practical reading: use these systems to generate a long list and to rank your priorities — not to generate weights you execute. The difference between the two is a data verification layer, and it is the one part the model will not build for you.
One text file, five stages, 314 agents working in parallel.
The idea is simple to describe and hard to execute. Instead of asking a model “what are the best forty U.S. stocks?” — a question it will answer from training data with total confidence and stale numbers — you build a research pipeline that imitates how a real desk works, and then you run it.
Ours runs in five stages, each feeding the next:
What separates this from a clever single question is that every agent in stage two opens its own context window for exactly one stock, reads its own sources, and writes its own note. None of them sees the other 301. Then a single agent in stage three reads all 302 notes at once and applies the constraints.
Prose cannot show you what fan-out means. This can.
The tool below replays the actual run stage by stage: from one file, to eleven sector agents, to three hundred-odd research notes coloured by the score they received, to forty positions, and finally to the audit that found what did not hold. Every number in it is read from the run's own output files — how many each agent screened, the scores it gave, and the final weights.
Press play to watch one text file turn into 302 pieces of research and then into 40 positions. Every number here is read off the actual July 2026 run — none of it is illustrative. Click any sector agent to see what it screened and what it kept.
The first agent does no research at all. It reads the plan and splits it, spawning 11 agents — one per GICS sector — each with a scope that cannot overlap another's.
Partition before you research. An agent that researches and delegates at the same time does both badly.
Click an agent for its detail
Source: the run's own output files — 302 scored stocks and 40 committee positions, July 2026. Illustrative of a research process, not investment advice.
Three technical reasons, all downstream of one limitation in language models.
If you could ask a single model in a single conversation to analyse three hundred stocks, none of this would be necessary. It does not work, and the reason has a name.
We deliberately chose a Chinese open-source model — to test a widely repeated claim.
The question we get more than any other: are the Chinese models actually cheaper and better? Rather than answer in theory, we built an entire system on one and measured the result.
Kimi K3, from the Chinese lab Moonshot AI, is a 2.8-trillion-parameter mixture-of-experts model with a one-million-token context window, released in July 2026 — the largest open-weight model shipped to date. Its benchmark record is not one story but two. On GDPval-AA v2, which measures real-world work across 44 occupations, it placed third with 1,687 points, behind Claude Fable 5 Max (1,815) and GPT-5.6 Sol Max (1,747.8). But on the Frontend Code Arena it placed first at 1,679, ahead of Fable 5.
The research run described in this guide happened on 6 July 2026, on K2.6 — what was available at the time. K3 shipped ten days later; the 3D scenes were built on it afterwards, and it is what you will be running if you execute the prompt today.
We flag this because conflating two versions is common in coverage, and because the audit findings below belong to K2.6 specifically — don't charge them to a model that did not produce them.
There is a story behind the lab worth telling. Yang Zhilin, born 1992 in Shantou, Guangdong, holds a bachelor's from Tsinghua and a PhD from Carnegie Mellon, and is a co-author of both XLNet and Transformer-XL — two of the reference papers in this field. He interned at Google Brain and Meta, then returned to co-found Moonshot AI in March 2023 with two Tsinghua classmates. Elon Musk called the lab's “Attention Residuals” paper “nice work,” and later responded to K3's coding-arena result with a single word — “Impressive.” Kimi's reply: “Your rockets are also pretty good.”
All of it sits inside a larger context Jensen Huang has described bluntly: roughly 50% of the world's AI researchers are Chinese, and China accounts for around 70% of AI patent filings — despite the restrictions on its access to advanced chips.
This is the most practical point in the guide, and it is not about the model. It is about the shell the model runs inside. When you use any model through a browser tab, you are using it stripped of everything: it cannot read your files, create files, run scripts, or hold a project. That is why most practitioners work through the terminal, where the model has real authority over the machine — but the terminal is not for everyone.
Kimi Work is a desktop application for macOS and Windows, launched in June 2026, and it sits exactly in between: it gives the model what a terminal gives it — reading files, creating them, running jobs — behind a graphical interface a financial analyst or a lawyer can use with no technical background. Three of its features are what made this project possible at all:
The plugins used here were S&P Global Market Intelligence for standardized fundamentals, SEC EDGAR for official filings, Yahoo Finance for prices and estimates, and the IMF and World Bank for macro context — all available inside the app with no separate subscription.
This is not a detail. A model with no data source will not tell you it needs one. It will search the web, or answer from training data, and hand you a result that looks entirely sound. Missing data does not surface as an error. It surfaces as an answer.
We also used an off-the-shelf skill called equity-research — essentially a Markdown file describing an equity analysis methodology step by step. You can install a ready-made skill, or simply ask the model to write one that describes how you work.
437 lines that were not written in one sitting — they distilled out of several failed runs.
The prompt below is not a first attempt. It is the residue of several full conversations, each of which exposed a flaw in the one before it. That is itself a technique worth stealing: when you finally get output you like, ask the model to write the prompt that would produce it, then keep that and run it again.
It is built around one idea called a stage gate: rather than loading every tool up front, each stage declares exactly which tools load at that point. This stops the model from drowning in options it does not need yet.
| Stage | Agents | Input | Required output | Quality gate |
|---|---|---|---|---|
| 1 — Sectors | 11 in parallel | one GICS sector each | sector brief + 10 scored candidates | macro context + sector risks |
| 2 — Stocks | 300+ in batches | one ticker | six-dimension note + score + rating | every dimension covered and sourced |
| 3 — Committee | 1 agent | all notes | 40 positions + weights + watchlist | sector cap ≤ 20%, quality ≥ 6 |
| 4 — Report | 1 agent | committee document | 16-slide deck | passes the format checker cleanly |
| 5 — Visualization | 1 agent | committee document | interactive 3D scene | hover, tooltips and panels work |
The portfolio construction rules are stated inside the prompt in language that leaves no room for interpretation: a quality floor of 6, a 20% sector cap, a position size derived directly from the score (9 → 3.0–3.5%, 8 → 2.5–3.0%), and at least eight sectors represented. Hold on to those rules — we return to them in the audit, because the model broke them in 11 of 40 positions.
No sign-up, no email, no gate. This is the unmodified Markdown file: five stages, the agent roles, the required plugins, the portfolio construction rules, and the quality gate for each stage. Attach it to a fresh conversation and tell the model to execute it.
Use it as a starting point, not as gospel. It was written for one specific job and audited to a score of 3.7/10 — the structure is sound, the data layer is not. Read section 08 before you trust any number it produces, and add your own verification step.
Three failures, and one human intervention that changed the whole run.
Demos show systems running smoothly. This one did not, and the deviations are the most useful part of the experiment.
The run was halted manually and redirected in plain terms: “dispatch 300 agents for 300 stocks — stick with what I'm saying.” It then executed properly across three batches of roughly 110 agents each.
The transferable lesson: do not hesitate to stop the model. The pull toward finishing early is a recurring behaviour in these systems — the task gets completed in form and hollowed out in substance. Watching a run is not optional supervision; it is part of running it.
The run ended with 302 stocks actually scored — not exactly 300, and not the 320 it appeared to be heading toward midway. The final score distribution reveals something important: the overwhelming majority landed in the middle, and only 44 fell to 5 or below, the “avoid” band.
| Score | 3 | 4 | 5 | 6 | 7 | 8 | 9 |
|---|---|---|---|---|---|---|---|
| Stocks | 2 | 12 | 30 | 65 | 109 | 71 | 13 |
| Ratings | Buy 73 · Hold 201 · Watchlist 27 · Avoid 1 | ||||||
What actually came out the far end of the pipe.
The committee produced 40 positions spread across all eleven sectors, with a stated average quality score of 8.35, 33 Buy-rated and 7 Hold-rated. The five largest positions — Microsoft, TSMC, NVIDIA, Alphabet and Parker-Hannifin — each at 3.5%.
| Sector | Weight | Positions | Screened from |
|---|---|---|---|
| Financials | 19.5% | 7 | 27 |
| Information Technology | 15.0% | 5 | 29 |
| Health Care | 12.5% | 5 | 29 |
| Industrials | 12.0% | 5 | 27 |
| Communication Services | 8.5% | 3 | 27 |
| Consumer Staples | 7.5% | 3 | 26 |
| Consumer Discretionary | 7.0% | 3 | 30 |
| Energy | 6.5% | 3 | 27 |
| Materials | 5.0% | 2 | 27 |
| Real Estate | 3.5% | 2 | 25 |
| Utilities | 3.5% | 2 | 28 |
| Total | 100.5% | 40 | 302 |
Now look at the total of that first column: 100.5%. That is the first thread we pull in the next section.
This is where the demo ends and the useful part begins.
Most published coverage of these tools stops at the attractive screenshot. We took the output, ran it against our production database and the factor engine we operate, and checked every verifiable number against its source. Final score: 3.7 out of 10 — a good idea-generation tool, not an executable document.
The portfolio sits at the 78.5th percentile on our quality axis and 64.6th on safety. The names it chose really are high-quality companies with solid balance sheets — the first promise was delivered.
Valuation percentile 33.5 — more expensive than two thirds of the market. The second claim in the report's own title is contradicted by the data.
Figures pulled from financial statements — margins and revenues — came back excellent: Sherwin-Williams gross margin 49% against 49.0% in our data, TransDigm net margin ~22% against 21.9%. The price-derived figures — the multiples — were badly unstable.
| Claim | Stated | Reality | Why it matters |
|---|---|---|---|
| PLTR price/earnings | 375× | 138.3× trailing · 71.5× forward | that number was the stated reason for excluding it |
| Apple share price | $264 | $312.66 | same-day close — off by 15.6% |
| Mastercard operating margin | 39% | 58.3% | understates the second-best margin held |
| Apple revenue | $451B | $416.2B | 35 billion dollars that do not exist |
| Weights total | 100.5% | 100% | the simplest possible check, absent from the checklist |
The Apple note says, verbatim, in its sources line: “404 error — no results… Yahoo Finance API: rate-limited, no data retrieved.” The same note then issues a valuation verdict: “trading around $264.” The actual close that day was $312.66.
This is not random hallucination. It is the deterministic result of a specific equation: a prompt that requires the model to cite a number + a data fetch that fails silently = an invented number. The model is required to fill a field, the field is empty, so it fills it from training data. And it will not tell you.
The report contained no backtest and no index comparison. We ran one, using the stated weights literally, from 2025-08-01 to 2026-07-28, on closing prices without dividends:
The detail matters more than the headline. Of the +10.38 points of return, +9.46 — 91% of it — came from four names representing 12% of the portfolio's weight (Alphabet +98.5%, TSMC +71.4%, Palo Alto +88.4%, Parker-Hannifin +37.1%). The remaining 36 positions — 88% of the capital — produced less than one point between them.
When the portfolio is split by the quality score the system assigned, the return ordering was genuinely consistent: score 9 returned +16.23%, score 7 returned +12.26%, score 8 returned +9.13%, and score 6 returned −20.42%. The scoring system is not internally random — but it selected from a universe that lagged the index outright, so even its best tier trailed.
A beta of 0.645 and a max drawdown capped at −8.68% are real value to a defensive investor. But the report measured none of it and claimed none of it — the product's best property was unknown to its maker.
The prompt states that a score of 8 means a weight between 2.5% and 3.0%, and that a score of 6 is “watchlist only.” In the final portfolio: ten score-8 positions came in below the floor, and a score-6 name entered as a full position. The rule was broken in 11 of 40 positions.
And finally the number that summarises everything: the Pearson correlation between the quality score the entire portfolio was built on and our factor engine's overall ranking is 0.066 — effectively zero. Between the assigned weight and that ranking: 0.024. The practical consequence is that the best names by our measure received the smallest weights.
The map that carries this experiment into any other domain.
If you take one thing from this guide, take this split. The failures were not randomly distributed. They all clustered on one side.
The number that makes all of this meaningful — or meaningless.
The subscription is sold in tiers rather than by usage, which changes the arithmetic completely: Adagio is free with limited credits and two scheduled tasks; Moderato is $19 a month; Allegretto is $39 with an expanded swarm capped at a limited number of sub-agents; then Allegro at $99 and Vivace at $199 — and only those last two unlock the full 300-agent swarm.
At the API level the comparison is cleaner: Kimi K3 costs $3 per million input tokens and $15 per million output, against $5/$25 for Claude Opus 5 and $5/$30 for GPT-5.6 Sol — roughly 40% to 50% cheaper depending on which side you compare. On a cost-per-completed-task basis, K3 lands at $0.94 against $1.04 for GPT-5.6 Sol and $1.80 for Claude Opus 4.8.
Is this institutional-grade work? No. Is it close? Closer than is comfortable. And at twenty dollars a month the right question is not “does it match a specialist analyst?” but “what is the alternative at this budget?” — and the alternative is usually nothing at all.
No prior experience assumed. These are the steps in order.
What was built here is real: a research pipeline covering 302 stocks, applying explicit constraints, producing a report, a portfolio and files — running monthly on its own for less than the price of a dinner. The shape it produced is correct by professional standards, and the quality bias it claimed survived contact with our factor engine. That is not a small result.
What was not built is equally real: a data verification layer. Without one, the output — however polished — is a list of ideas that need review, not weights to execute. The difference between the two is not in the model and not in the prompt. It is in the layer you have to build yourself, and that no model will tell you is missing.
Take the prompt. Run it. Change whatever you like. But when you read its output, remember that the dangerous number is never the strange one — it is the one that looks perfectly reasonable and has no source.
This guide is part of ongoing work on AI systems in financial markets. News coverage and analysis in the newsroom, and the full working methodology is documented on the methodology page.
Disclosure: this is educational content explaining a research methodology. Nothing in it is a recommendation to buy or sell any security. The names mentioned appeared as the output of a technical experiment that was audited and found not executable as-is.