⚡ Start Here — Should I use COT now?
Before reading the full guide, test whether the current COT week is worth your time in 60 seconds:
- Open /ar/cot about 20 minutes after Friday 3:30 PM NY.
-
Does the AI Weekly Report card mention a significant shift?
- YesRead it in full, then proceed to step 3.
- NoThe week is quiet, follow up tomorrow.
-
Are there symbols with a score ≥ 70 in the Conviction Quality filter?
- YesOpen the details page for each symbol of interest.
- NoJust stick to monitoring the Heatmap.
-
On the details page: Does the full panel confirm the score (≥ 3 components supporting the trend)?
- YesLook for a second confirmation (Seasonality or historical pattern) then plan your entry.
- NoThe reading is fragile, skip it.
If you are a trader new to COT, read sections 1 and 2 then go directly to ★ Friday Workflow — it is the actual usage roadmap.
1 What is the COT Report?
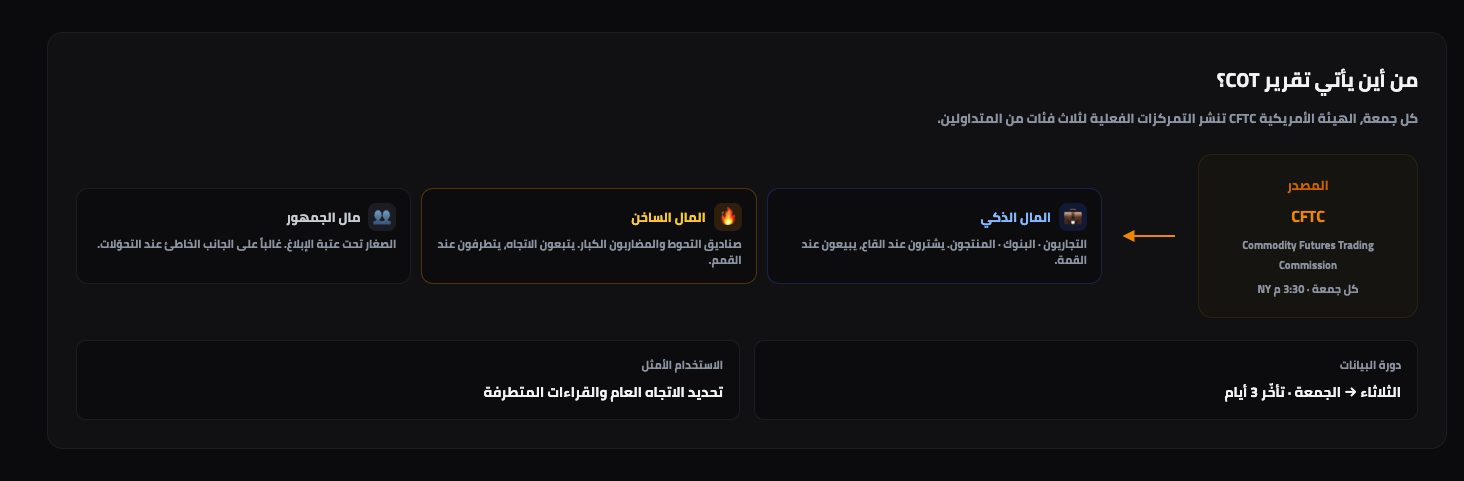
The COT (Commitments of Traders) report is the official weekly record of positions in the US futures markets, issued by the US agency CFTC (Commodity Futures Trading Commission) every Friday at 3:30 PM New York time. It shows how many futures contracts are held by each type of trader — from commercial banks and producers to large hedge funds and retail traders.
A Quick History: Why was the report created in the first place?
The CFTC established its activity in 1974 under the Commodity Futures Trading Commission Act, after decades of excessive speculation on grains and metals in the 1960s and 1970s. The mandatory goal was transparency: forcing every large trader to report their positions so that the regulator and the market as a whole would know who is moving prices. The weekly report began in its modern format in 1986, and later evolved into four official specialized types for each sector.
The Four Types of COT Reports
When reviewing market data on EL7.AI, you will find that commodities use the Disaggregated report, currencies and indices use TFF, agricultural commodities have an additional Supplemental version, and the old historical format is still issued under the name Legacy. Choosing the appropriate report determines how we name the categories (e.g., "Dealer" vs. "Commercial").
| Report | When it is used | Primary Categories |
|---|---|---|
| Legacy | Historical format — all markets | Commercials · Non-Commercials · Non-Reportable |
| TFF Traders in Financial Futures | Forex · Indices · Treasuries · Crypto | Dealer · Asset Manager · Leveraged Funds · Other Reportables |
| Disaggregated | Commodities: Gold · Oil · Gas · Copper · etc. | Producer/Merchant · Swap Dealer · Managed Money · Other Reportables |
| Supplemental (CIT) | Agricultural commodities only (Corn · Wheat · Cotton · etc.) | Adding Index Traders to the standard report |
"Reportable" — Who reports and who doesn't?
The CFTC requires every trader holding positions exceeding a certain threshold (e.g., 200 contracts in the Gold market) to report their position daily — these are Reportable Traders, and they typically represent 80–95% of Open Interest. The rest are positions of small traders (Non-Reportable) often referred to by the public as "the crowd" or "small traders". The golden rule: when the crowd's positions reach an extreme in one direction, history rewards the opposite side.
Why does it matter?
📊 Reveals Smart Money
Verified numbers from a regulatory body — no talk or opinion, but actual open contracts for each category.
🧭 Provides Price Context
If Gold rises and speculators exit at the same time, this is a sign of weakness despite the rise.
📜 Used for Decades
Larry Williams, Steve Briese, Jason Shapiro — they all built strategies around it.
🔄 Reveals Major Shifts
Position Flips precede major market moves because they represent a real change in institutional conviction, not just daily noise.
🎯 Supports Market Selection
Instead of monitoring 50 markets, the quality filter helps you focus on 3–5 high-probability setups each week.
📐 Quantifiable
Everything in the report is numbers: COT Index, Z-Score, concentration ratios, price divergence — suitable for building backtestable strategies.
⏱ How is the report released weekly?
The COT cycle has been fixed weekly for decades. Understanding this cycle helps you know when you should update your pages on EL7.AI, and why reading a single week is not enough.
This is the "Report Date" that always appears on our pages. All the numbers you see refer to the closing positions on Tuesday.
3 days of mandatory processing — this lag is inherent and cannot be bypassed. Any claim of "real-time COT data" is incorrect.
Published in 4 file formats (txt · xls · xml). All platforms analyze the same file — the difference is in how it is presented.
BullMQ scheduling pulls the release, calculates COT Index, Z-Score, Concentration Ratios, and Conviction Scores, then updates the live pages. Usually 10–15 minutes after release.
Decisions are made between two releases. COT alerts (Section 16) are sent to you automatically for any reading worth noting.
2 Landing Page /ar/cot
The starting point — a comprehensive overview of all markets we cover in one place, with 3 layers of information stacked: Weekly Summary, Top Readings, and a Heatmap. Open /ar/cot now to follow this section in parallel with the live product.
What do we actually display on this page?
The landing page is not just a list of markets — it is layers of summarization arranged so that you get the full picture in 30 seconds, then dive deep into a specific market in 3 minutes. The first layer (AI Weekly Report) answers "What are the most prominent shifts this week?", the second layer (Market Summary + Quality Filter) extracts the top 10 setups from among 50+ markets, and the third layer (Heatmap) gives you the ability to scroll visually and discover markets you weren't even looking for. The pattern is intentional: from aggregate at the top to detailed at the bottom.
The page contains six cards arranged from top to bottom:
1. AI Weekly Report
Summary of the top 3 shifts in Arabic — released every Friday.
2. Market Summary
Number of Bullish markets / Total / Bearish + 5-level distribution bar.
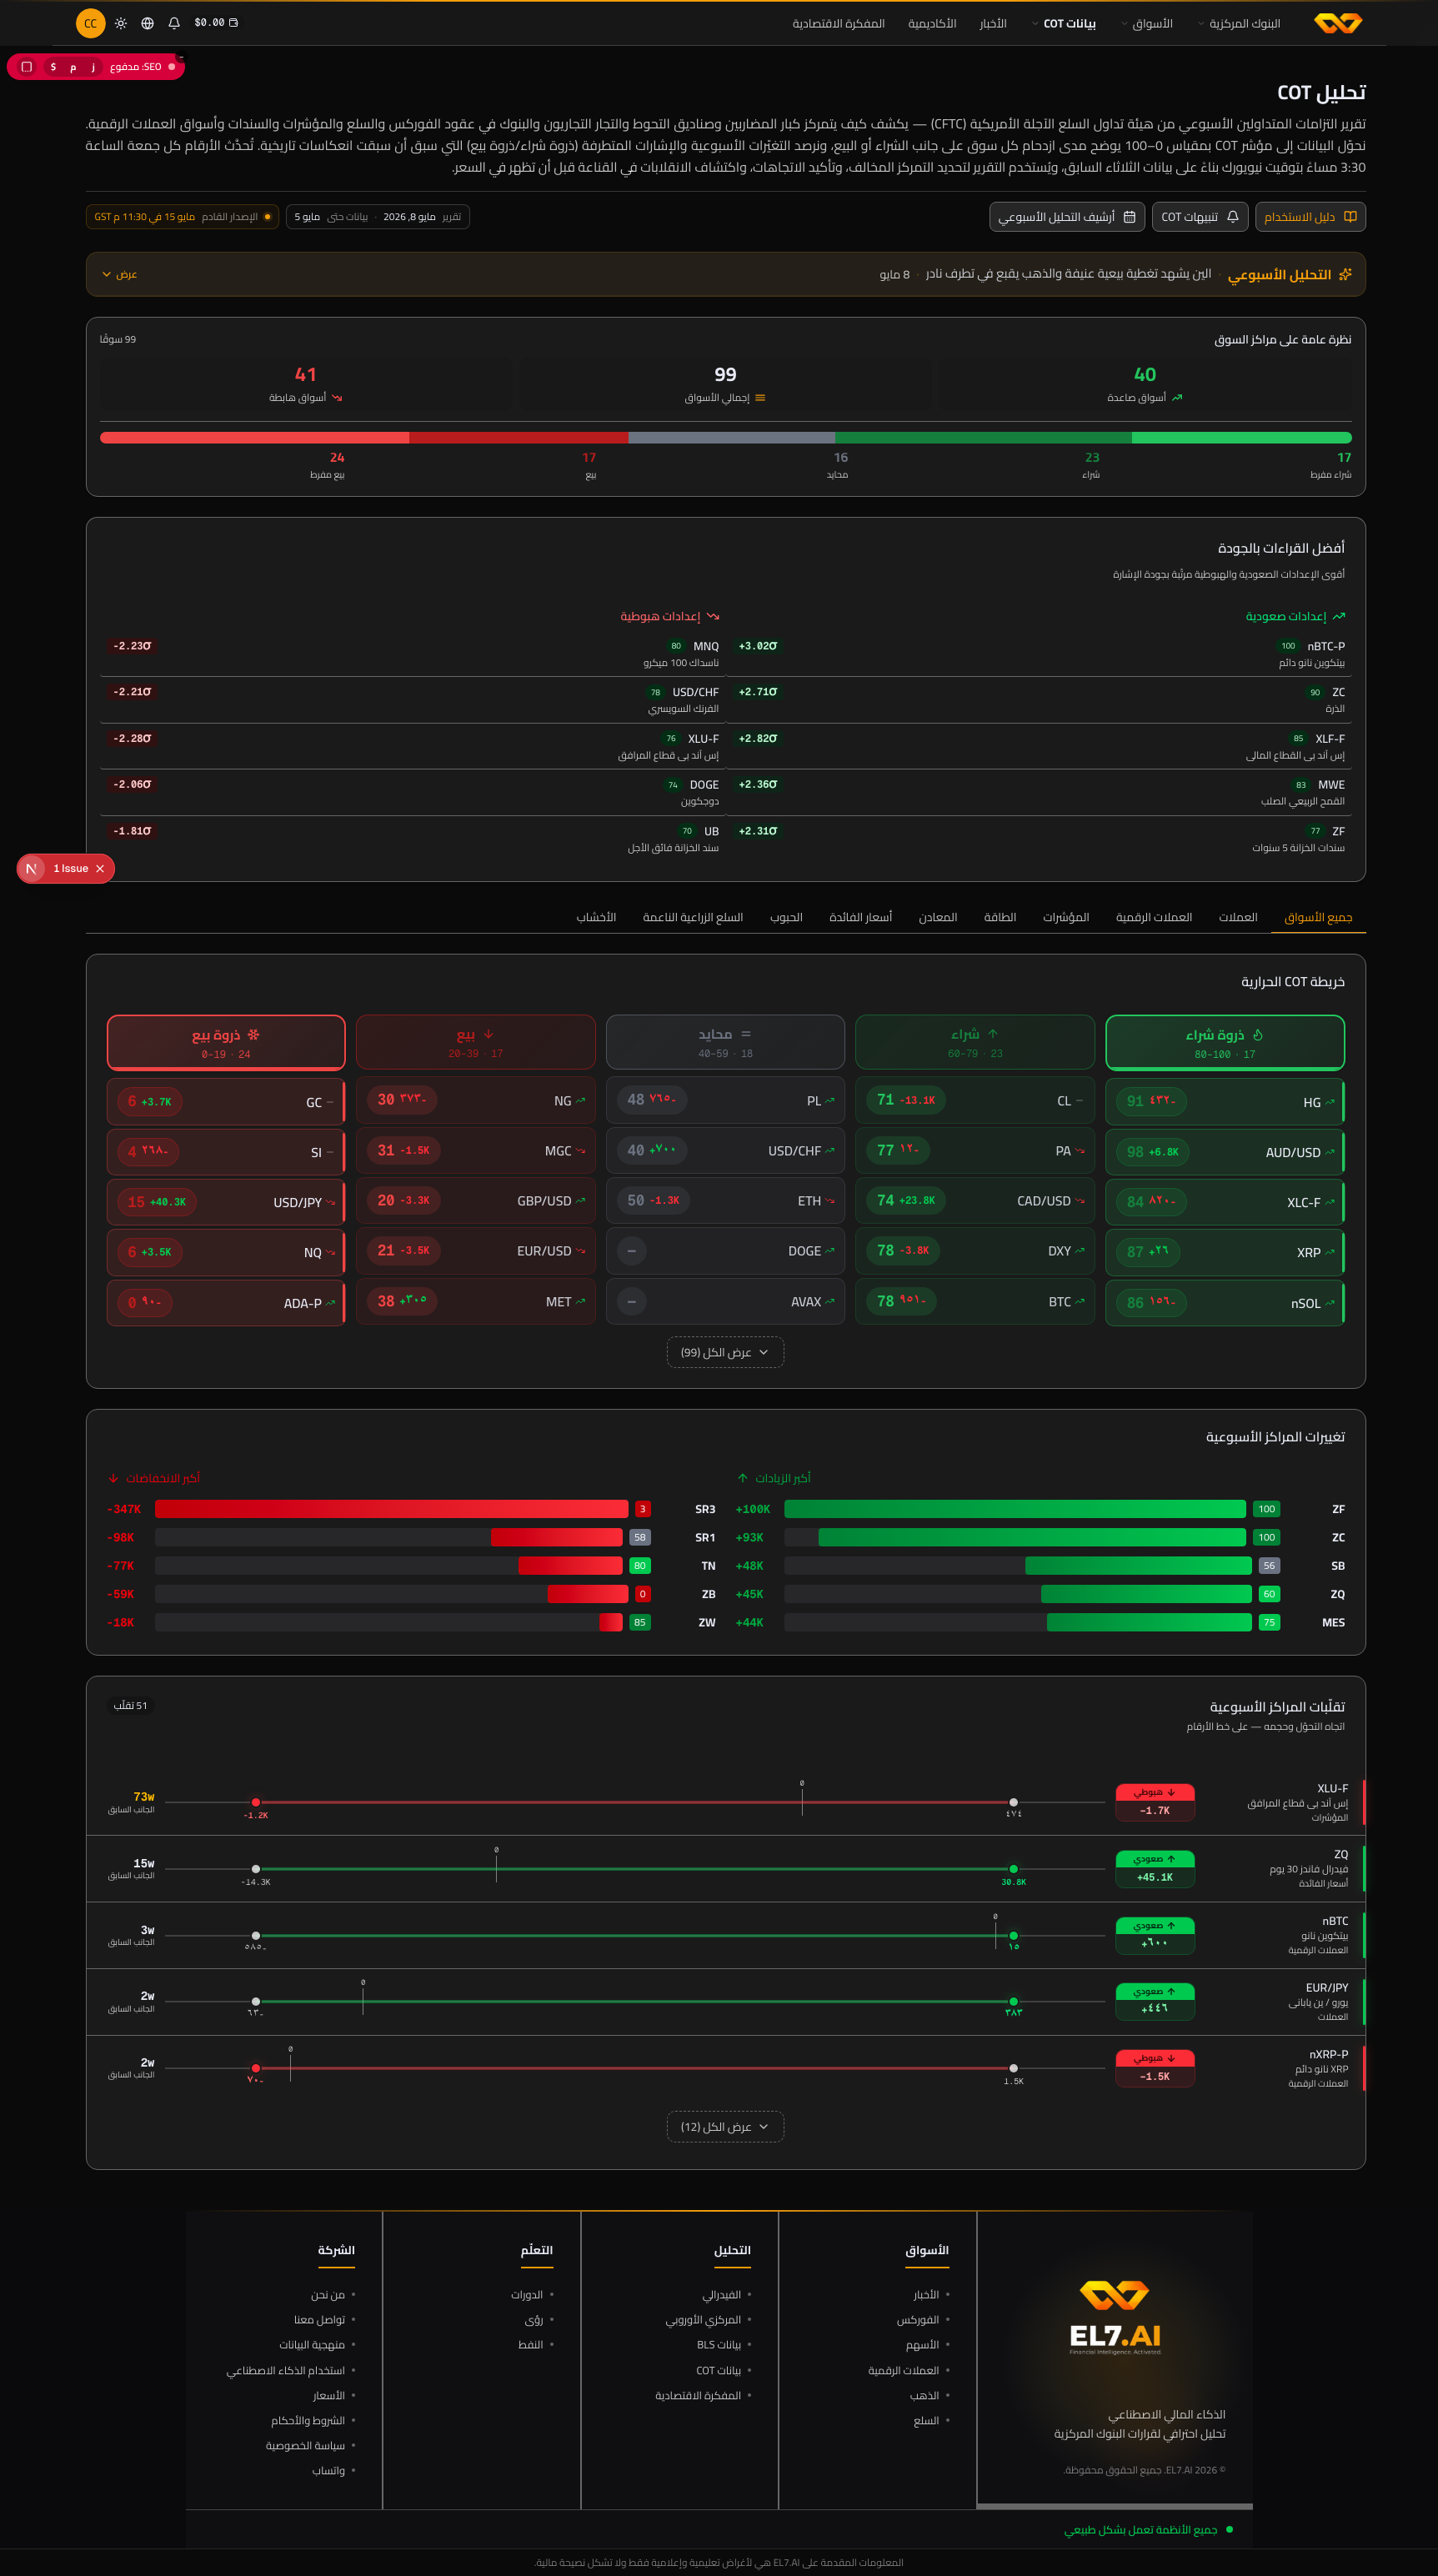
3. Conviction Quality Filter
Top 5 Bullish + Top 5 Bearish sorted by score.
4. Heatmap
50+ markets with COT Index — with filtering by category (Currencies, Metals, Energy…).
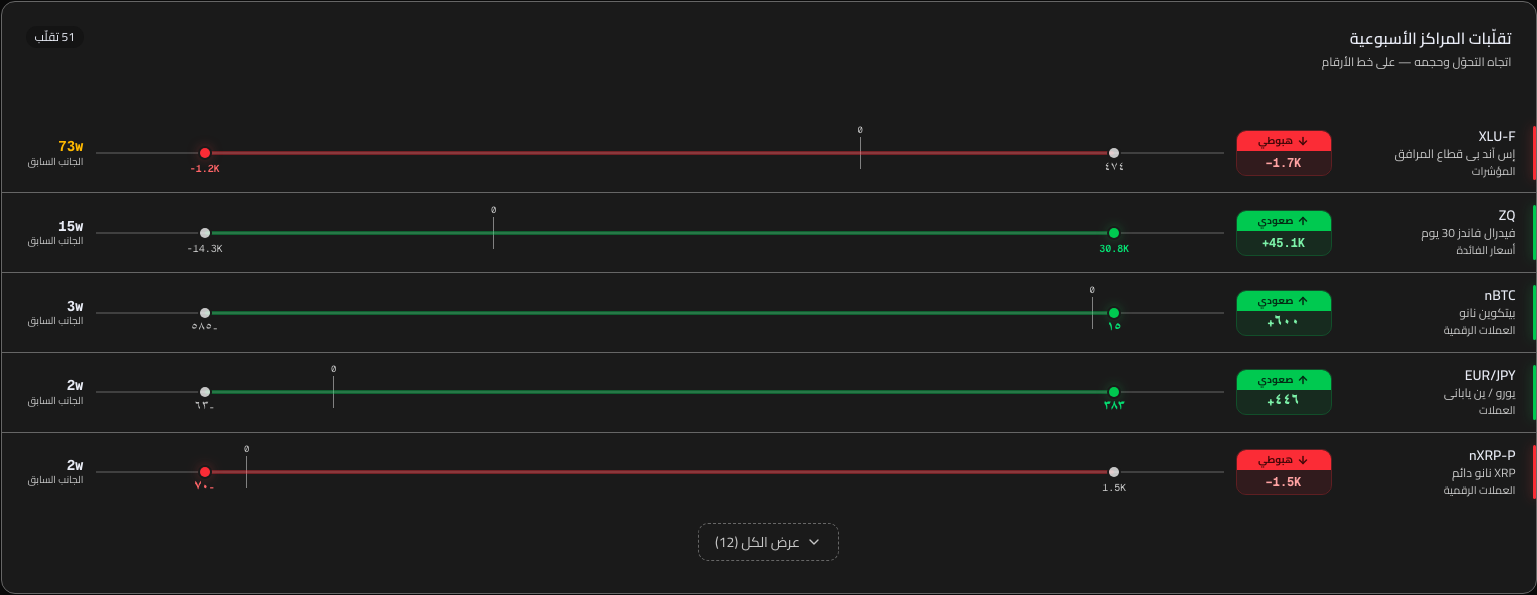
5. Biggest Movers
Who increased Long / Short positions this week — Bullish + Bearish.
6. Position Flips
Who flipped from Long to Short or vice versa (last 8 weeks).
Market Summary Card Details
The second card summarizes the overall market mood in one line. Three boxes at the top of the card: Bullish Markets (green number — total markets in "Buy" or "Extreme Buy"), Total Markets covered, and Bearish Markets (red number — total "Sell" + "Extreme Sell"). Below it is a horizontal distribution bar with five colors showing the actual percentages: Extreme Buy → Buy → Neutral → Sell → Extreme Sell. A 5-second reading tells you if the week is "Bullish Pressure", "Bearish Pressure", or "Balanced".
How to use it practically
On Friday, open the page after 4:00 PM New York time (15–20 minutes after the CFTC release, when data has automatically updated on EL7.AI). Start by reading the AI Weekly Report in 60 seconds — it will draw your attention to the two or three biggest shifts. Then take a look at the Market Summary: Is the balance heavily tilted (e.g., 32 Bullish vs 6 Bearish)? This is important general context. Then move to the Conviction Quality Filter — do symbols you care about (GC, CL, EUR/USD, etc.) appear in the top 5 with a score ≥ 70? If yes, click the symbol directly to enter the details page. If no, take a quick look at the Heatmap searching for markets at the boundaries (dark red or dark green) — you might find a setup you weren't expecting. The "Biggest Movers" and "Position Flips" sections at the bottom of the page are useful when you want to see weekly momentum and rare reversals.
3 Conviction Quality Screener
The second card — a shortcut to the strongest setups of the week. Two columns: Top 5 Bullish + Top 5 Bearish, ranked by a signal quality score from 0 to 100.
| Symbol | Score | Z-Score |
|---|---|---|
| GC (Gold) | 87 | +2.8σ |
| CL (Crude Oil) | 82 | +2.5σ |
| BTC | 68 | +2.1σ |
| NQ (Nasdaq) | 61 | +1.9σ |
Each row is a direct link to the details page for that market, where the full Conviction Quality panel appears with a detailed narrative.
How the Score is Calculated — and What it Means in Practice
The score is the same Conviction Quality Score displayed in full on the details page (Section 6). The model combines five components — Signal Magnitude, Directional Purity, Concentration, Reporting Coverage, and Participation Size — each component has a cap of 20 points, and the total gives the overall reading from 0 to 100. The screener on the homepage displays only the final score to give you a quick ranking, while the full panel on the details page shows the breakdown of the five components so you know the source of the reading.
A score of 70+ historically corresponds to a "High Watchlist Priority" reading, while 40-69 means "Requires additional study before entry" (look for confirmation from Seasonality or Historical Patterns), and < 40 means "Ignore this reading this week." These thresholds are not execution orders — they are a ranking of probabilities. The final decision remains yours after reading the risk context and additional confirmations.
How to Use the Screener Weekly
Step one: Read the green column (Bullish) and the red column (Bearish) side-by-side. If the green column is "heavy" (average scores higher than the red column), then bullish setups are stronger this week overall — and vice versa. Step two: Focus on the top two or three symbols in each column with scores > 70, and ignore the rest. Step three: Click on the symbol that interests you to enter the details page, where you read the Full Conviction Quality Panel (Section 6) with the five-component breakdown and AI narrative. Step four: If the full panel confirms the score, look for a second confirmation from Seasonality or Historical Patterns before entry. The screener is a watchlist, not an execution list.
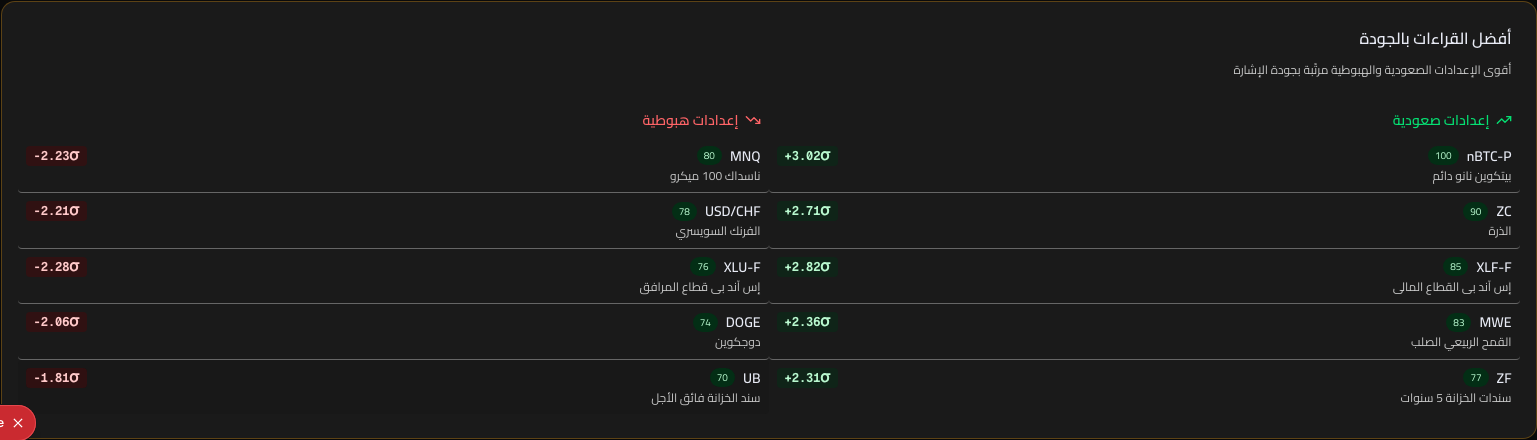
4 Weekly Position Flips
When did large speculators flip from Long to Short or vice versa for the first time in several weeks — a shift signal in speculator positioning, indicating a real change in conviction rather than weekly noise.
Last 8 Weeks · 5 Flips Detected
| Symbol | Direction | Before | After | Weeks Before Flip |
|---|---|---|---|---|
| EUR | To Short | +12K | -8K | 28w |
| CL | To Long | -45K | +22K | 31w |
| 6J | To Short | +3K | -14K | 12w |
The orange badge on "Weeks Before Flip" appears automatically when the count is ≥ 26 weeks — a signal that the flip occurred after half a year on one side, which gives it greater statistical weight.
Why Flips Deserve Attention
Most changes in COT positioning are weekly and small — routine adjustments that do not mean a shift in conviction. But when a category moves from Net Long to Net Short (or vice versa) after staying on one side for many weeks, this indicates a fundamental event: the institutional view of price direction has changed, and large speculators have decided to reallocate their capital to the opposite side. Historical studies on 20 years of CFTC data show that flips occurring after 26 weeks or more generate strong trends in the new direction for an average duration of 8-14 weeks, with a success rate exceeding 65% in major currency markets.
The table on EL7.AI sorts flips from newest to oldest and shows four crucial columns: New Direction (Long or Short), Value Before Flip (Net Position last week), Value After (this week), and Number of Weeks the category spent on the previous side. The last column is the most important: 5 weeks = noise, 15 weeks = medium signal, 26+ weeks = major shift, 50+ weeks = historical event worth opening a full follow-through trade.
How to Use Flips in Your Decisions
When seeing a flip with a badge ≥ 26 weeks on a market you follow, do not execute immediately. Go to the details page for the relevant market and read the Conviction Quality Panel — if the score is < 60, the flip may be caused by a few large traders, not a broad shift, and will not last. If the score is ≥ 70, check the Position Flow Matrix: Is the flip driven by new building (opening positions in the new direction) or by closing old positions? New building is stronger because it shows a commitment of new capital, while closing may be temporary. Finally, if Seasonality supports the new direction, you have a three-layer setup (Flip + Quality + Seasonality), which is one of the strongest signals you can get from COT.
5 Detail Page per Market /en/cot/{symbol}
Deep details for every market we cover. This is where you evaluate the trading hypothesis before execution. Order from top to bottom:
- Conviction Quality Panel — Judging the setup quality (Section 6)
- Key Indicator Cards — COT Index, Net Position, 52-Week Range, Open Interest
- Enhanced Stats — Z-Score, Percentile, Trend
- Smart · Hot · Crowd (Section 7)
- Position Flow Matrix (Section 8)
- Concentration & Breakout Risk (Section 9)
- Divergence Alert (Conditional)
- AI Analysis (Conditional)
- Historical Pattern Finder (Section 10)
- COT Seasonality Alignment (Section 11)
- Chart with Macro Events (Section 12)
- Tabs (History · Breakdown · Price Overlay)
Page Philosophy: From Macro Judgment to Details
The detail page is designed on the principle of "read from the top until you find what you need, then stop". At the top, the Conviction Quality panel provides an immediate judgment: is the reading worth following or not? If the score is < 40, you can close the page and move to another market without reading further. If the score is 40-69, continue reading to look for supplementary confirmations. If it is ≥ 70, read the entire page to get the full strategic picture — because this is the market that will be worth opening a trade in this week.
The top-to-bottom order is not random — it follows the decision-making sequence: (1) Is the signal real? (Quality), (2) How strong is it? (Key Cards and Z-Score), (3) Who is behind it? (Smart/Hot/Crowd), (4) What type of movement? (Flow), (5) Is it fragile? (Concentration), (6) Does the price align with it? (Divergence), (7) What happened historically in a similar situation? (Patterns), (8) Does the season support it?, (9) Were there macro catalysts? (Events), (10) What does the full history look like? (Table). Each section answers only one question — no distraction.
How to Read the Page Step-by-Step
Start by reading the Big Score in the middle of the Quality panel (the number out of 100). This is the first filter — if it is < 40, close the page. Then read the AI Narrative below it — 3 sentences clearly explaining what distinguishes this reading. Then move to the Key Cards (COT Index, Net Position, Z-Score, Percentile) to know the numerical dimensions. If the signal continues to confirm, go down to Smart · Hot · Crowd to know who is behind the reading. Now you have an 80% complete picture. If you want to go deeper, look at the Historical Patterns in the middle to see what the price did after similar readings — this adds the probability layer. Finally, the Chart with Events at the bottom gives you the full temporal vision and the reasons for previous major shifts.
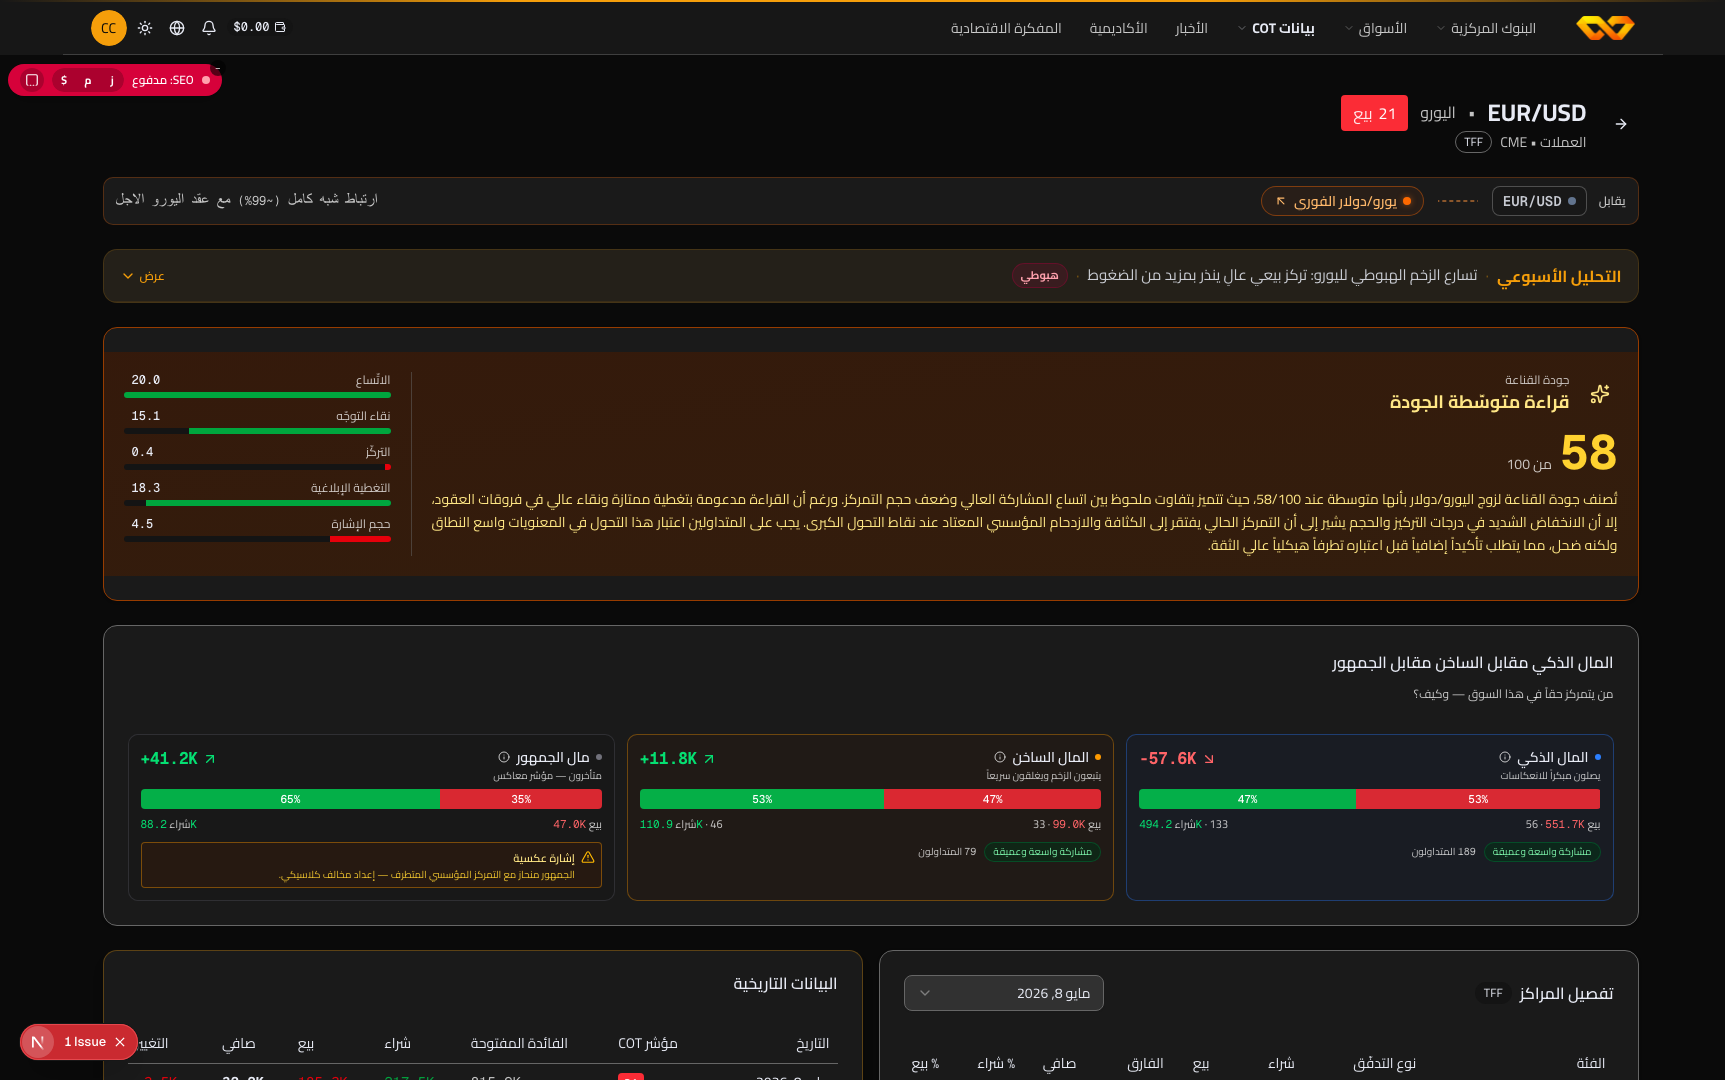
6 Conviction Quality Panel (Main)
The most important feature of the platform. It answers the question no one else answers: "Yes, the reading is extreme, but is it real?"
A traditional COT panel says "95% Overbought" — we say "95% Overbought but Quality is 38/100, meaning positioning is concentrated in a few traders and spreading contracts represent 40% of the volume. Do not build a trade on this reading alone."
The Five Components (Each out of 20)
Example: EUR/USD · Score 71/100 · High Quality Reading
| Component | What it Measures | High = What |
|---|---|---|
| Breadth | Number of reporting traders in this market | Real depth, not just a few whales |
| Directional Purity | Ratio of directional vs. spreading positions | True directional positioning, not just calendars |
| Concentration | Share of the top 4 traders in volume | Positions are distributed, not monopolized |
| Reporting Coverage | Share of reportables out of total Open Interest | Complete picture, not just the speculators' side |
| Signal Magnitude | Absolute annual Z-Score | Historically extreme positioning, worth attention |
The Three Scores
High Quality (70+)
Extreme reading with broad participation, directional purity, and low concentration. The signal deserves high priority on the watchlist.
Medium Quality (40–69)
Mixed reading. Combine it with technical analysis before execution.
Low Quality (<40)
Thin, concentrated, or spreading reading. Do not build a trade on this alone.
The panel also displays a short AI narrative (two to three sentences) explaining why this specific score was achieved, with a clear indication of which component contributed positively or negatively.
Why Five Components and Not One?
An extreme reading (e.g., Z-Score = 3σ) does not necessarily mean a strong signal. A practical example: one massive hedge fund opens a 15,000 contract Long position in Gold — Net Position will jump significantly, Z-Score will become extreme, but the reading is not "market conviction," it is the conviction of one trader. Therefore, we measure five independent dimensions: Breadth tests the number of contributing traders (is the reading due to 5 whales or 300 reportables?), Directional Purity tests whether positions are truly directional or spreading, Concentration tests whether positions are distributed or concentrated in the hands of the top 4, Reporting Coverage tests whether the report represents the whole market or just a part of it, and Signal Magnitude tests the absolute historical extremity.
The five components each give a maximum of 20 points, and the total is added to give 100 points. A result ≥ 70 means that at least 3-4 components are pointing in the same direction, which is the definition of structural conviction. A result ≤ 40 means the signal relies on only one or two components — enough to spark interest, but not enough to give it high weight in your decision.
How to Use the Panel in Your Decisions
Read the main score first — this is a quick filter. Then look at the five bars below it: which component pulled the score down? If Concentration is high on the opposite side, you are facing a vulnerable reading — a handful of whales might cover their positions all at once, doubling the move against the signal. If Directional Purity is low, the reading is spreading (e.g., monthly calendars) and not a pure directional bet — ignore it. If Signal Magnitude is low (< 1.5σ) despite the rest being high, the reading is good but not extreme — watch it for another two weeks to see if it develops. Finally, read the AI Narrative which summarizes the picture in 3 sentences — it usually gives you a deeper understanding than looking at the numbers alone.
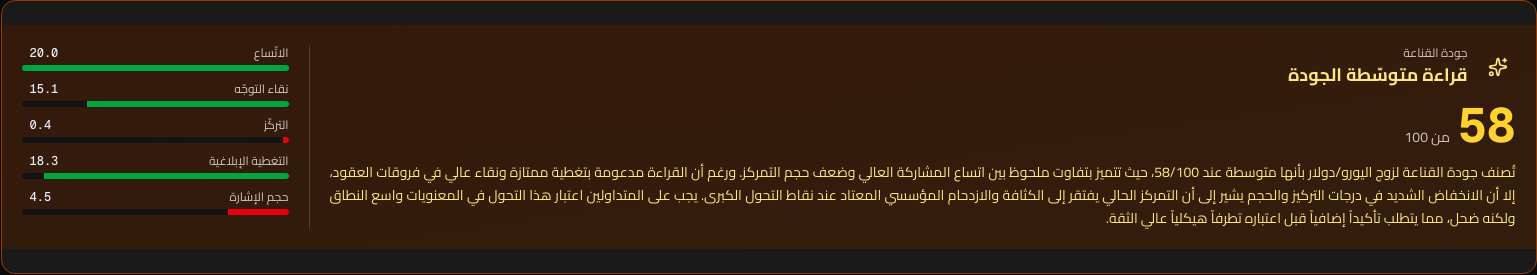
7 Smart · Hot · Crowd
3 cards side by side. Each card represents a different type of money, with labels understood by traders rather than technical CFTC terminology.
💼 Smart Money
Commercials who actually use the commodity — Producers, banks, industrial hedging firms. They buy when the price is low, and sell when it rises. Often counter-trend.
🔥 Hot Money
Large speculators — Hedge funds, CTAs, Managed Money. They trade for profit, following the trend. Their weakness: at extreme positioning, they become victims of market reversals.
👥 Crowd Money
Small traders below the official reporting threshold. Often on the wrong side during major shifts — their extreme positioning is used as a contrarian signal.
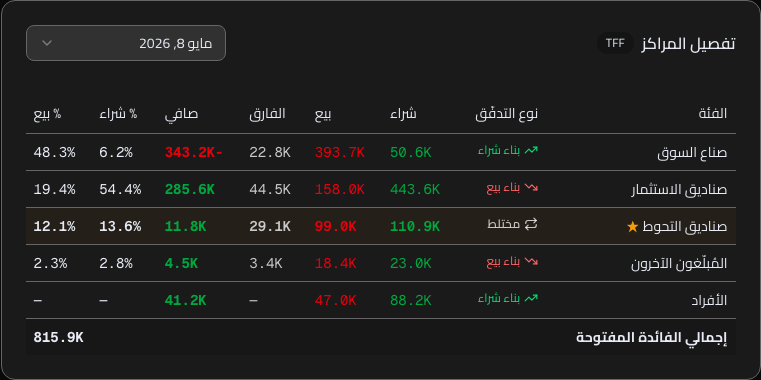
What each card displays
- Combined categories (e.g., "PM + SD" for Smart Money in commodity markets)
- Net Position (Long − Short) with arrow and coloring
- Breakdown of Long and Short with the number of traders on each side
- Average contracts per trader (whale detector)
- Status badge: Broad Participation / Concentrated Whale Bet / Limited Participation
Why do we use "Smart" and "Hot" labels instead of official CFTC categories?
CFTC reports use technical terms (Dealer, Asset Manager, Swap Dealer, Producer/Merchant, etc.) useful for institutional analysts but confusing for the average trader. We merge official categories based on historical behavior rather than label: In financial markets (TFF), we group Dealer + Asset Manager together because both play an institutional hedging role — this is "Smart Money." Leveraged Funds alone represent the true speculators — "Hot Money." In commodity markets (Disaggregated), we merge Producer/Merchant + Swap Dealer (Smart), and isolate Managed Money (Hot). This simplification makes the reading immediate and aligns with statistical reality: historically, Smart Money defined this way has won 65-70% of trades against Hot Money in major currency and commodity markets.
The third card, Crowd Money, represents the Non-Reportable category in CFTC reports — which are positions of small traders below the mandatory reporting threshold. This category is not published as a direct position by the CFTC, but is calculated by inference from the difference: total Open Interest minus reported positions. The Crowd is often on the wrong side during major shifts because it follows news and emotion — therefore its extreme positioning is considered a contrarian signal.
How to use the three cards together
Read the cards in a specific order: Smart first, Hot second, Crowd third. If Smart and Hot are in the same direction (both extreme Net Long), the market is in institutional agreement — follow the trend. If they are in opposite directions (Smart Long, Hot Short for example), wait until the market resolves the conflict. The most important setup: Hot + Crowd in the same extreme direction — this is a rare intersection that occurs 3-5 times a year and generates the strongest historical reversals. The orange signal on the Crowd card alerts you immediately when this pattern forms.
Also monitor the average contracts per trader in each card. If this number rises sharply in the Hot card (e.g., from 2,500 to 4,200), the reading is driven by a few whales rather than broad participation. A market in this state is fragile — any counter-move will force the whales to cover quickly. The "Concentrated Whale Bet" badge at the top of the card alerts you to these conditions automatically.
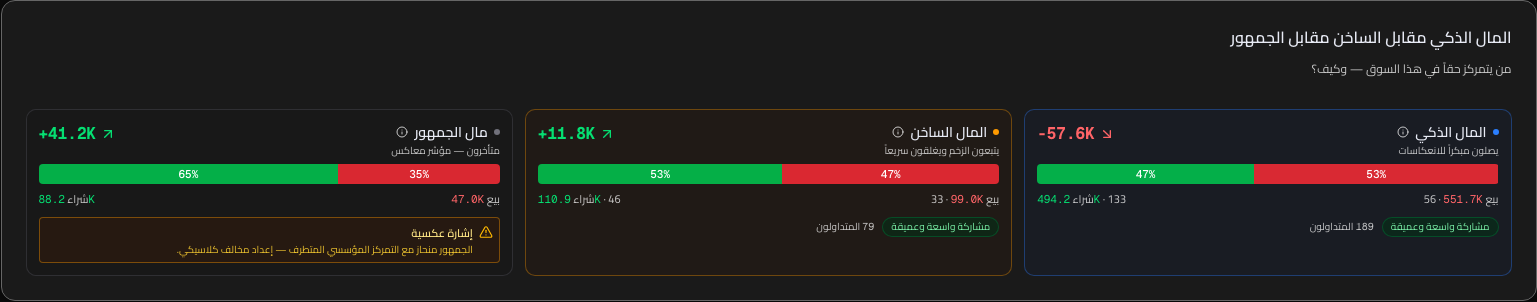
8 Position Flow Matrix
This is the panel that distinguishes real movement from reordering. It is precisely labeled at the top: "What kind of movement occurred this week — new buildup, closing, or just a rollover?"
The Seven Patterns
| Pattern | What it means | Color |
|---|---|---|
| Long Buildup | Adding new Long positions (possibly with Short closing) | Green |
| Short Buildup | Adding new Short positions (possibly with Long closing) | Red |
| Short Covering | Closing Short positions (may cause a rally) | Light Green |
| Long Liquidation | Exiting Long positions (selling pressure) | Light Red |
| Long Closing / Short Liquidation | Exiting without new buildup | Orange |
| Mixed | Both sides moved with equal strength | Gray |
EUR/USD Example This Week
Dynamic System: Rotation · Confidence 60%
| Category | Type | Δ Long | Δ Short | Δ Net | Of Total Change |
|---|---|---|---|---|---|
| ⭐ Dealer | Short Buildup | -4,762 | +29,268 | -34,030 | +25% |
| Asset Manager | Long Buildup | +18,100 | -5,400 | +23,500 | +17% |
| Leveraged Funds | Short Covering | +2,800 | -14,200 | +17,000 | +12% |
| Other Reportable | Mixed | +1,200 | +1,500 | -300 | +2% |
⭐ The "First Mover" star appears automatically next to the category with the largest contribution to the total change in Open Interest — "who moved first this week."
Why Flow is More Important Than Net
Most COT dashboards display only "Net Position" (Long - Short). However, a static Net might hide massive movement: one category closed 40,000 Long contracts and opened 40,000 Short contracts, while another category did the exact opposite — the Net of the entire market hasn't changed, but the internal structure has flipped. The Position Flow Matrix deconstructs the weekly change into its core components at the level of each category: how many Long contracts were added, how many Short contracts were closed, what is the Net for this category, and its percentage of the total change in Open Interest. This breakdown answers questions that Net cannot: Is the movement a new buildup or just a rotation? Who led the shift? Is everyone in agreement or are they divided?
Historically, the category with the largest percentage of total change (indicated by the "First Mover" star) predicts the direction of the following week 58-64% of the time in major markets. This is not a high percentage in absolute terms, but it is sufficient for a probabilistic bias — especially if the driving category is Managed Money or Leveraged Funds (professional speculators). The "⭐" badge on the row allows you to see this information immediately without manual calculation.
The Seven Systems and What Each Case Means
The Rotation system shown in the EUR/USD example above is the most deceptive — it appears "quiet" on the total Net but hides a sharp internal conflict. Do not open a trade in this situation — wait until the market resolves the conflict in the following week or two. The Full Agreement system occurs when all categories move in the same direction — rare but the strongest, indicating a sustainable trend. The Sharp Split system occurs when categories are split 50/50 in direction — indicating a decision moment in the market, and the following week is crucial. The other four systems (Long/Short Buildup, Short Covering/Long Liquidation) express different stages of the positioning cycle, and each has its meaning in the context of the current price.
How to Use the Matrix Practically
Start by reading the large badge at the top (System Name + Confidence). If confidence is < 50%, the system is unclear — ignore the matrix and refer back to sections 7 and 8. If confidence is ≥ 60%, look for the star (⭐) to identify the First Mover. Then look at the "Of Total Change" column: which category led the shift this week? Read the "Δ Net" column for the driving category to know the direction of movement, and the "Δ Long" and "Δ Short" columns to see if it is a new buildup or liquidation. Look for Managed Money or Leveraged Funds specifically — their movement is the most indicative. Finally, compare the direction of this category with the price direction during the week — if they are aligned, the signal is confirmatory; if they are opposite, there is a potential divergence (see the next section).
9 Concentration and Breakout Risks
Application Video: COT here measures something that nothing else measures — Road Risk. When one side of the market is monopolized by a few, it becomes fragile.
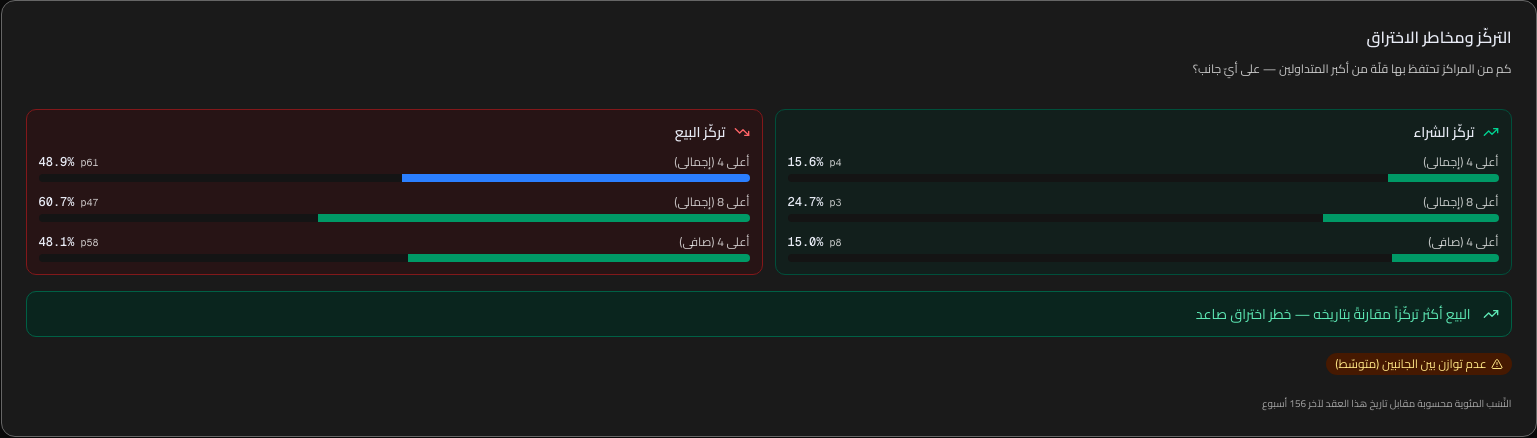
Two Cards
Right card = Long side concentration. Left card = Short side concentration. Each card displays 3 ratios:
- Top 4 (Gross) — The share of the 4 largest traders out of the total positions on this side
- Top 8 (Gross) — The same for the 8 largest
- Top 4 (Net) — Net after excluding hedged positions
EUR/USD Example (Recent)
📈 Long Side
📉 Short Side
The common area among competitors stops at Net Position. We add a "Concentration Divergence" layer that gives you an idea of how sharp a potential reversal might be.
Why Concentration Matters More Than Net
Historically, 8 of the 10 largest reversals in Gold and Oil markets during 2018-2025 were preceded by high concentration (> 40% for Top 4) on one side. The mechanism is simple: when price moves against a side monopolized by a few whales, they are forced to cover quickly because they use high leverage and cannot afford long-term losses. Rapid covering doubles the price movement in the opposite direction and ignites a reversal wave. Conversely, if positions are distributed among 80 different traders, each decides independently and there is no "collective covering moment" — the market moves in an orderly fashion.
The difference between Gross Concentration and Net Concentration is important: Gross includes all positions including hedged ones (like monthly spreads), while Net excludes hedged positions and shows only true directional bets. We display both numbers together because the discrepancy between them reveals additional information: if Gross is high and Net is low, whales are hedging most of their positions — it's not a directional bet but spread strategies. If both are high together, the bet is purely directional and prone to reversal.
How to Use the Panel in Your Decisions
Read the colored Alliance Judgment bar at the bottom of the panel first — it summarizes the situation in one sentence. If the judgment "Bullish breakout risk" appears, look for technical confirmation for a Long entry (resistance break, reversal candle, positive harmonic pattern). If "Bearish breakout risk" appears, do the opposite. If concentration is balanced (both < 30% or both > 30% but close), the judgment is neutral — there is no specific breakout risk at this moment, ignore the panel and focus on other signals. Finally, when the "⚠ Extreme Concentration" badge appears on any card, do not go against the dominant trend even if the reading looks tempting — whales have the ability to keep the price in their direction for weeks before the reversal.
10 Historical Pattern Finder
The most influential standout feature. We answer: "In the last N times that positioning looked like it does now, what did the price do after 4, 8, and 12 weeks?"
Using cosine similarity on a 13-week window of Z-Scores, we match current positioning with all similar historical periods, extracting the average, median, and success rate for future returns.
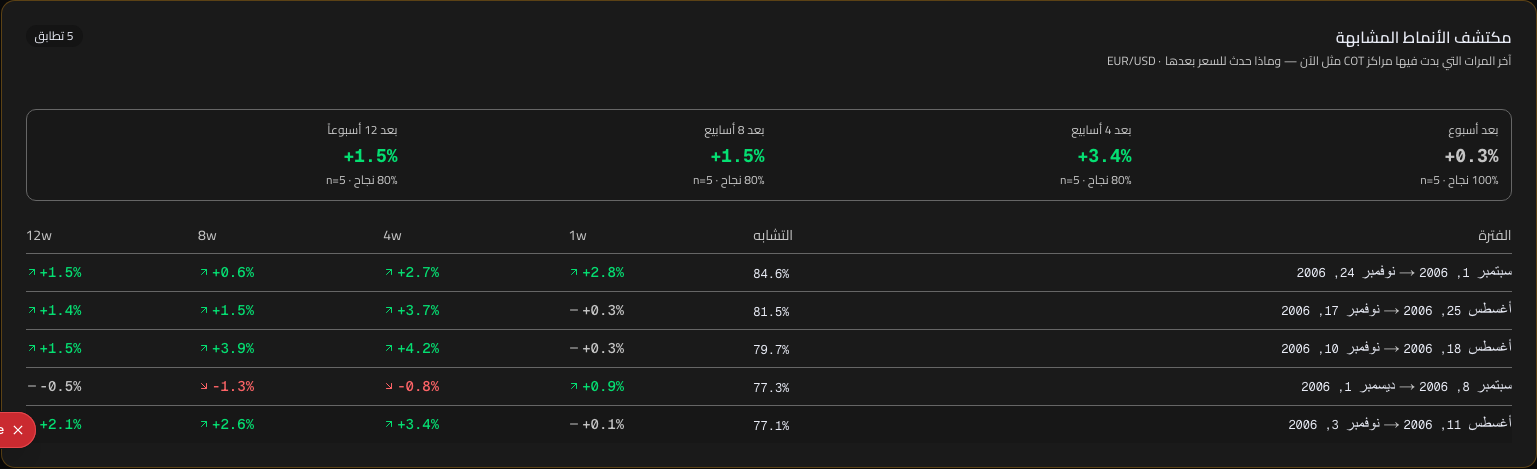
Example GC (Gold) — 5 Matches
Summary: Last 5 times → average +4.2% after 12 weeks · 80% success
| Period | Similarity | 4 Weeks | 8 Weeks | 12 Weeks |
|---|---|---|---|---|
| Mar 2023 → Jun 2023 | 94.2% | +2.1% | +5.8% | +7.4% |
| Aug 2019 → Nov 2019 | 91.7% | +1.8% | +3.2% | +5.1% |
| Jan 2018 → Apr 2018 | 88.4% | -1.2% | +0.8% | +2.9% |
| ... | ... | ... | ... | ... |
Each match displays:
- Historical period (From → To)
- Similarity percentage (0-100%)
- Actual price return at 4, 8, and 12 weeks after the period ended
If the market in question has no price data (some accounting commodities only), we hide the return columns and display matches without the "Summary" — similarity alone is still useful for understanding "what happened next in COT".
Why cosine similarity and not simple correlation?
When comparing multi-dimensional positioning (5 categories of traders × 13 weeks = a vector of 65 values), simple linear correlation (Pearson) only measures the general direction of movement. Cosine similarity measures the angle of the vector in multi-dimensional space, thus matching patterns identical in shape even if their magnitudes differ. Practically, this means: a setup where "Speculators built shorts for 13 weeks then started bullish accumulation" will match a historical pattern similar in shape, regardless of the absolute size of the positions. This is much more important because searching for absolute matches yields few results, while searching for shape matches yields 5-20 analyzable historical analogs.
The 13-week window is not arbitrary — it is a sufficient time period to capture a full positioning cycle (accumulation → peak → liquidation) but short enough not to "choke" the algorithm with long-term noise. We tested 8, 13, and 26-week windows on 15 years of CFTC data, and found that 13 provides the best balance between a statistically sufficient number of matches (≥ 4 matches) and the accuracy of future return prediction.
How to read the table and execute
Start with the Summary at the top — average returns after 4, 8, and 12 weeks and the success rate ("80% success" means 4 out of 5 historical matches ended in a move consistent with the expected direction). If the sample count is < 3, do not trust the statistics — it is a weak signal. If ≥ 5 matches with a success rate ≥ 70% and an average return ≥ 3%, the signal is strong and deserves full weight in your decision. Then look at the individual rows: are the matches recent (mostly in the last 3 years) or old (mostly before 2018)? Recent matches are more reliable because market structure changed after 2020 (increase in quantitative CTAs, new entry of Asset Managers). Finally, use the longest timeframe (12 weeks) as the trade target, and 4 weeks as the maximum duration to verify the hypothesis — if the price does not move in the direction of historical matches within 4 weeks, the setup has failed and you should close the trade.
11 COT Alignment with Seasonality
We summarize the relationship between current COT positioning and historical seasonality into a single verdict, providing you with a quick starting point before diving into the numbers. Four possible verdicts:
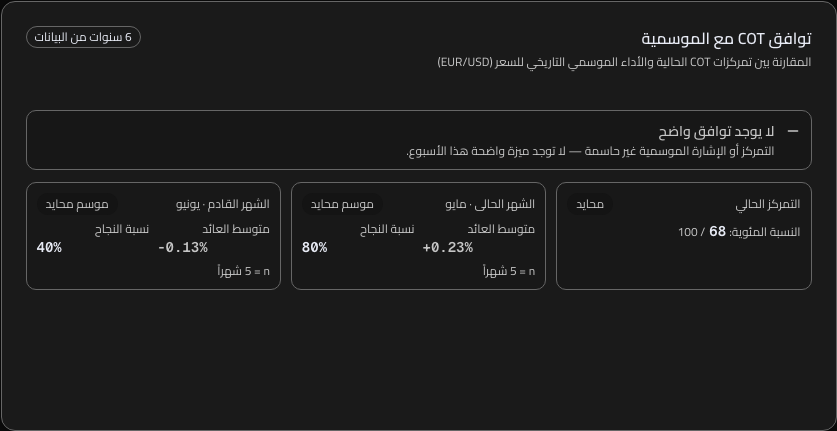
| Verdict | Explanation | Scenario |
|---|---|---|
| Bullish Alignment | Long positioning + Seasonally bullish month | Trend continuation with tailwinds |
| Bearish Alignment | Short positioning + Seasonally bearish month | Trend continuation with tailwinds |
| Reversal Setup | Extreme positioning against the seasonal trend | Candidate for reversal, consider contrarian strategies |
| No Clear Alignment | Signals are mixed | No clear edge this week |
The panel also shows:
- Current month and its historical performance (Average Return + Win Rate)
- Next month as an early warning
- Minimum of 5 years of historical data
Why Seasonality Works at All
Markets are not entirely random — there are recurring patterns driven by structural factors that do not change from year to year: the agricultural harvest cycle puts selling pressure on Corn in September-October, the heating season raises Natural Gas demand in December-February, US pension fund movements rebalance equities in the last week of every quarter, and US Treasury operations create recurring positioning in bonds at the end of each fiscal year. These patterns are not guesses — they are measurable economic phenomena proven over 10-20 years of data.
We calculate seasonality by the average monthly return for each market over the last 5-15 years, and compare it with the Win Rate (the percentage of years the price rose in that month). A month with a 75% Win Rate and an average return of +2.3% is considered a strong seasonally "bullish month". Combining this information with current COT positioning provides a Composite Alignment Verdict stronger than either of the two alone — and that is what our panel provides.
How to Use the Seasonality Panel in Your Decisions
Read the Main Verdict at the top of the card — the colors give you the signal immediately (Green = Bullish Alignment, Red = Bearish Alignment, Orange = Reversal Setup, Gray = No Alignment). The Bullish Alignment verdict is statistically the strongest — Long positioning + a seasonally bullish month has historically provided a 70-85% probability of success. Bearish Alignment is the same in the opposite direction. Reversal Setup is the most exciting — extreme positioning against seasonality suggests that speculators are making a wrong bet, and the probability of a reversal is high. The No Clear Alignment case means one of the two signals is weak — do not open a trade based on COT alone this week.
Also, look at the Next Month at the bottom of the card as an early warning — if you plan to open a trade for a week or two, ensure that seasonality will not flip against you halfway through. For example, if the current month is strongly bullish but the next month is seasonally bearish, consider a short-term trade (10-15 days) instead of a full month.
12 Macro Events on the Chart (FOMC · NFP · OPEC)
We place colored markers on the COT chart at every major macro event, so the chart becomes a story rather than just a series of numbers: When did the Fed issue a decision? When were the jobs data released? How did positioning move before and after each event?
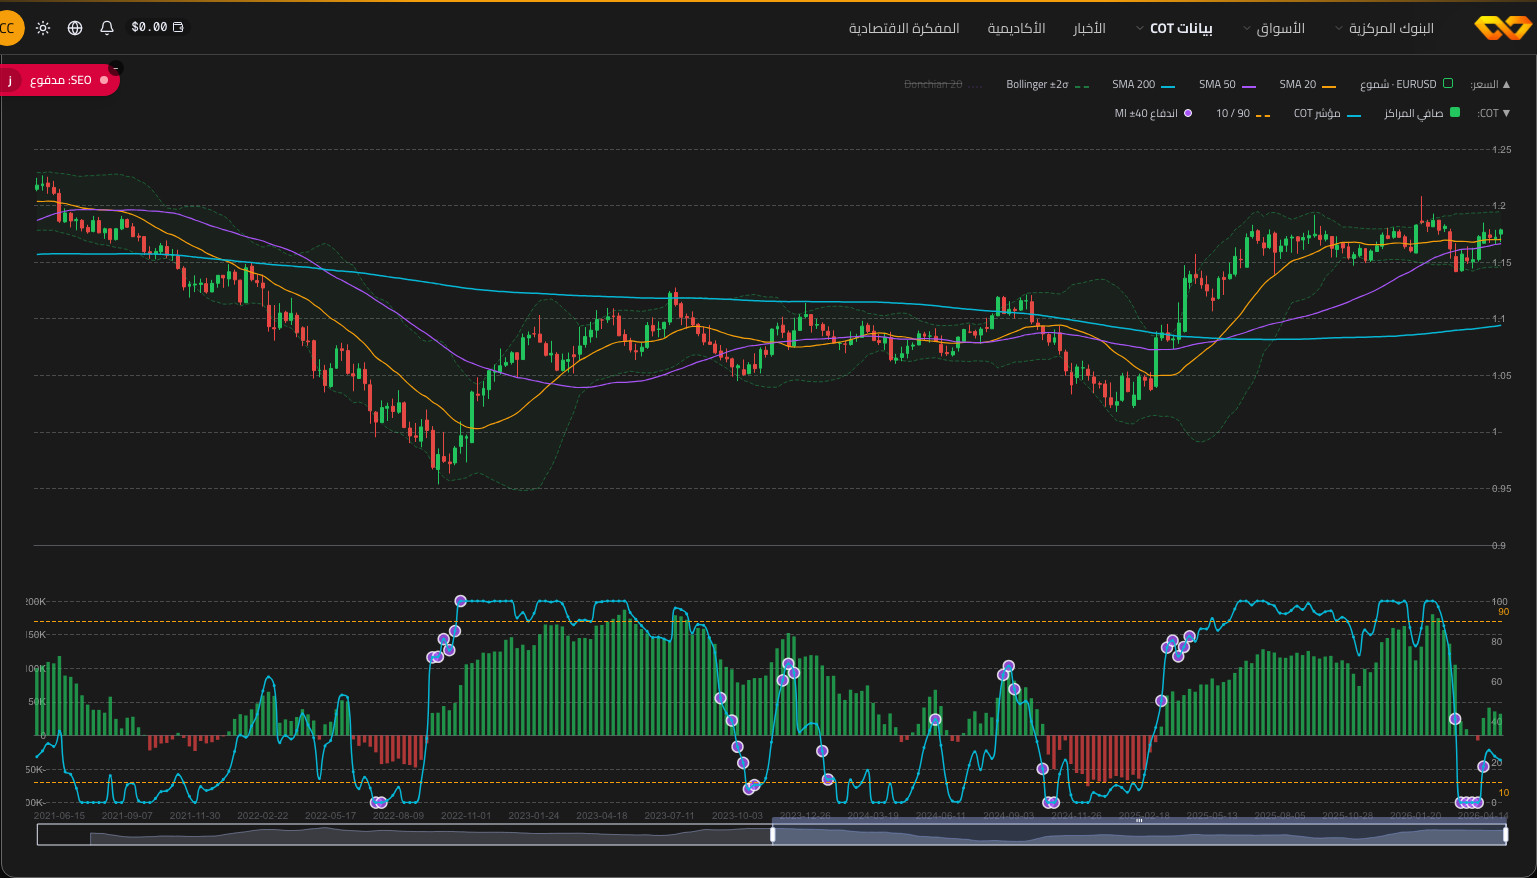
Events We Highlight
🔵 FOMC
Federal Reserve decisions with the interest rate decision in the tooltip. Appears at every official meeting.
🟠 NFP
Monthly Non-Farm Payrolls reports (first Friday) with actual vs. expected values.
🟢 OPEC
OPEC and OPEC+ meetings that impact oil and energy markets.
When hovering over any marker, a bilingual tooltip window appears with details: Title + Impact + Numerical values.
Which Events Matter to Which Markets?
Not every macro event affects every market to the same degree. FOMC (Fed decisions) has a direct and powerful impact on Treasury bonds, the Dollar, Gold, and US indices — these markets move 50-200 pips in minutes after the announcement. NFP (Jobs report) affects the Dollar, Gold, and indices more significantly, and to a lesser extent, commodities not linked to US consumption. OPEC+ has a dominant impact on Oil and Gas only, and a side effect on oil-linked currencies (CAD, RUB, NOK). Knowing which event matters to which market helps you filter the noise — do not see an NFP marker on the Gold chart and ignore it; rather, know that it holds a potentially important interpretation.
We pin the event marker to the next COT release date, not the date of the event itself. Why? Because what matters to the trader is how positions responded to the event, not the event itself. For example, if the FOMC holds its meeting on Wednesday, the marker appears on the Friday release that reflects the speculators' reaction to the Fed's decision. This positioning makes the chart directly readable as a "cause and effect story."
How to Read the Chart in the Context of the Decision
Read the chart from left (oldest) to right (newest). At each event marker, look at the COT Index in that week compared to the previous week — was there a sudden jump? If yes, the event had an impact. If the chart was flat around the event marker, the event did not affect the speculators' positioning in this market — ignore it in your analysis. Look for recurring patterns: Is every FOMC meeting accompanied by a jump in Long positioning on Gold? Was every OPEC meeting preceded by a build-up of Short positions a week in advance (anticipation)? If these patterns repeat three times or more, they become exploitable in a trading strategy.
13 COT Alerts /ar/cot/alerts
Create custom alerts on /ar/cot/alerts sent automatically after every Friday CFTC release. Five types are available:
| Type | When it triggers | Default |
|---|---|---|
| Extreme Reading | COT Index above 90 or below 10 | 10 |
| Position Reversal | Net Position flips from Long to Short or vice versa | 0 |
| Large Change | Weekly change exceeds a specific number of contracts | 10,000 |
| Divergence | Divergence between positioning and price appears | — |
| High Conviction Quality | Score exceeds a specific threshold (New!) | 70 |
Why we separate alerts from the main filter
The Conviction Quality filter on the home page gives you a snapshot of the week — the top 10 setups at release. However, your trades might need follow-up on a specific market week after week (e.g., if you are specifically tracking Gold regardless of its quality this week), or when specific conditions arise (Extreme Reading, Divergence, Reversal). Alerts allow you to customize follow-up behavior: define the markets and conditions you want to know about, and receive an immediate notification when they occur — without needing to open the page weekly.
Alerts are typically sent 15-20 minutes after the CFTC release (3:45-3:50 PM New York time on Friday), via email or within the EL7.AI interface. Each alert includes: the market, the reason (which condition was met), the current reading, and a direct link to the details page — so you can open the page in one second and see the full setup. No need for manual searching or navigation.
Practical Usage Strategies
"Macro Tracker" Strategy: Create a High Conviction Quality alert with a threshold of 75 without specifying a market (all markets). You will receive only 3-7 alerts per week, all regarding setups worth paying attention to. This is better than reviewing the page every Friday because it filters quiet weeks automatically.
"Custom Market" Strategy: If you are an exclusive currency trader, create an Extreme Reading alert with a threshold of 10 on EUR/USD, GBP/USD, USD/JPY, and AUD/USD. It will reach you only at extreme moments in your markets, regardless of the rest of the markets. 1-3 alerts per month on average.
"Reversal Hunting" Strategy: Create two alerts — Divergence and Position Reversal — on Gold and Oil. These two cases are rare (2-4 times per year per market) but represent the strongest historical reversal setups.
How to avoid alert fatigue
The most common mistake: creating 15 alerts with low thresholds to cover "everything." The result: receiving 20+ alerts weekly, ignoring most of them, and missing important signals in the noise. The golden rule: Maximum 5 active alerts at one time, with strict thresholds (Extreme Reading ≤ 5, Conviction Quality ≥ 75, Large Change ≥ 15,000 contracts). If you find an alert is sent more than twice a month without producing a decision, delete it or raise its threshold. The quality of alerts is more important than their quantity.
14 API Interface + CSV Export
For power traders who want to integrate COT data into their external systems (bots, Excel spreadsheets, proprietary models).
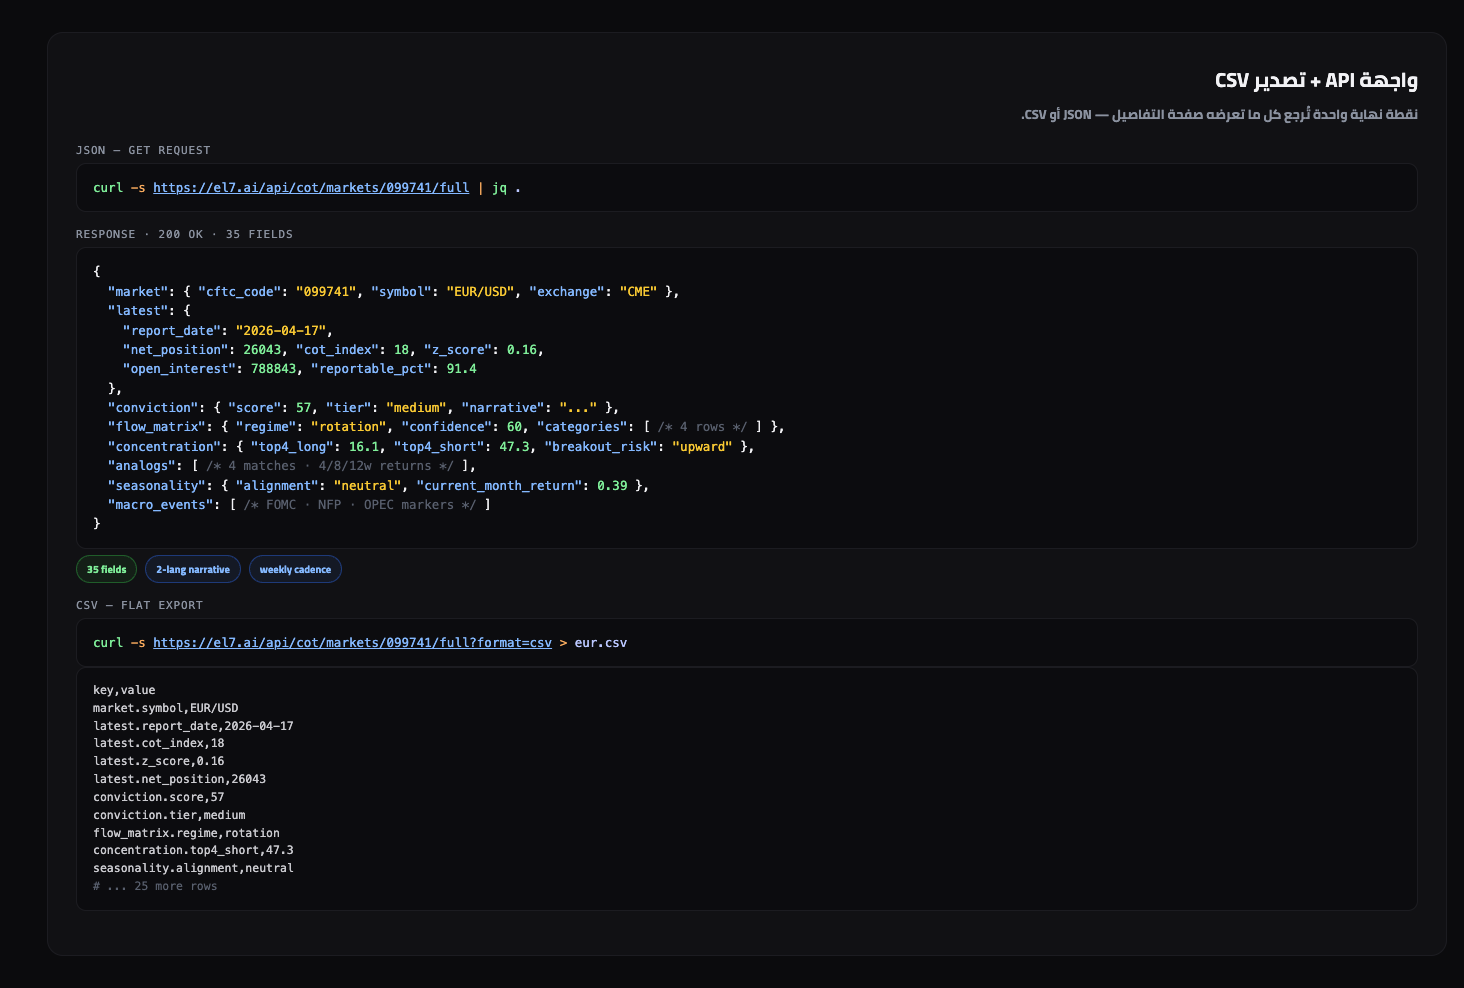
formatUnified Endpoint
GET /api/cot/markets/{cftcCode}/fullReturns everything displayed on the details page in a single request: market data, latest and previous report, statistics, quality panel, participation, concentration, flow, seasonality, patterns, macro events, and breakdowns.
CSV Export
GET /api/cot/markets/{cftcCode}/full?format=csvDownloads a flattened CSV file with 35 fields (key,value) with an automatically dated filename, ready for import into Excel or any analytical tool.
curl https://el7.ai/api/cot/markets/023651/full?format=csv > natural-gas.csv
Why API instead of HTML Scraping
You can analyze COT pages on EL7.AI with an HTML scraper, but this is fragile — a simple change in page design (adding a section, modifying CSS) will break the scraper. The API is stable because the contract between it and its users is clear: JSON keys are fixed, data types are documented, and any breaking change comes with a new version (v2 instead of v1). Additionally, the API is significantly faster (< 200 ms per request versus 2-4 seconds to load a full page with CSS and JS), and cheaper (no need to render HTML in a headless browser).
The unified endpoint /api/cot/markets/{cftcCode}/full returns
everything you need in one request — no need for multiple sequential requests. The market code
(cftcCode) is 6 digits according to the CFTC standard — you can obtain it from
the details page URL (e.g., EUR/USD is 099741, Gold is 088691). A full list
of supported market codes is available via GET /api/cot/markets.
Common Integration Patterns
Weekly Telegram Bot: A cron schedule on Friday 4:00 PM NY calls the API for every market you follow, filters results by score ≥ 70, and sends Telegram messages for strong setups only. 10 lines of Python are enough. Example:
import requests, json
for code in ["099741", "088691", "067651"]:  # EUR, GC, CL
  r = requests.get(f"https://el7.ai/api/cot/markets/{code}/full").json()
  score = r["conviction"]["score"]
  if score >= 70:
    send_telegram(f"{r['market']['symbol']}: {score}/100 · {r['conviction']['narrative']}")
Personal Excel Dashboard: Use the CSV link directly in Excel via Data → From Web, then refresh the data weekly with a click of a button. The flattened key,value format is easy to ingest into any pivot table format.
Quantitative Trading Strategy: Pull the API for 50+ markets weekly, save the readings in a database (SQLite is sufficient), and run a backtest on your own conditions. For example: "Open Long when quality score ≥ 75 and seasonality is bullish, close after 8 weeks." 3 years of historical data will suffice for statistically significant results.
Usage Limits
The maximum usage limit is 60 requests per minute per IP — exceeding the needs of any normal bot. Data is updated weekly only (after the Friday CFTC release), so there is no benefit to calling the API more than once a week for the same market. The API is available to all active EL7.AI users and is free for personal use. If you are building a commercial service based on it (e.g., a paid bot for clients), contact us to discuss a commercial agreement.
/api/cot/docs (coming soon). Currently, the best reference is the
actual JSON itself — try the endpoint with | jq . to see the full structure.
🔗 What does this mean for you? — Translation to the Spot Symbol
Every details page now begins with a card that translates the CFTC futures contract into the spot instrument you actually trade (EUR/USD spot, Gold XAU/USD, Bitcoin/USD, WTI Oil, and so on). The card's goal: no more "What does the Euro futures contract have to do with my spot trade?" — the answer is in the first card.
- Displays the spot instrument name in English + a note on the correlation with the futures contract.
- The "View Real-time Price" button takes you directly to the EL7.AI page for the instrument (if available).
- Niche markets (Livestock, Cocoa, Lumber…) appear with a "Non-spot market for retail trading" icon without a dummy link.
📘 Regime Playbook
The "Regime Playbook" panel under the Conviction Quality banner transforms the six regime classifications (Risk On · Risk Off · Rotation · Trending · Crowded Extreme · Neutral) into an actionable list:
- Current Regime Badge + Confidence Indicator reflects the accuracy of the classification.
- Confirming Signals — each item is marked ✓ (fulfilled) or ○ (not yet fulfilled). For example, in a Risk On regime: "Speculators flipped to Long", "No negative divergence with price".
- Invalidation Conditions — each of which will break the regime if met, for example "COT index drop below 20%" or "Flow shift to distribution".
Reading the card is a logical sequence with the cards before it: "What is the signal strength?" (Conviction) → "What is the next step?" (Playbook) → "When do I cancel the idea?" (Invalidation).
📈 Movement Index (6 Weeks)
The COT Index tells you where positioning stands; the Movement Index tells you how fast it got there. We measure the difference between the current COT Index and its value 6 weeks ago, placing it on a ±100 scale with a warning band at ±40.
- Bullish Surge ≥ +40 → Speculators are building Long positions at an unusually fast pace.
- Bearish Surge ≤ −40 → Rapid reduction in positioning.
- Surge Failure (Yellow Badge) — A ±40 surge appeared last week and then reversed. This is a warning signal for a potential regime change.
There is a new alert type movement_surge triggered when |Movement| ≥ your threshold (40 by default). Supported by alert limits per plan: Free=3, Pro=20, Premium=100.
🎯 Crowding × Sentiment
A four-quadrant card linking position crowding (0–100) with news sentiment for the spot symbol over the last 30 days. The orange dot identifies where the market stands:
- Bearish Reversal Signal (Buy Crowding + Negative Sentiment) → Classic reversal point.
- Late Trend Risk (Long Crowding + Bullish Sentiment) → Everyone is confidently bullish — time for caution.
- Trend Continuation (Short Crowding + Negative Sentiment) → Silence aligns with positions.
- Contrarian Point — Long (Short Crowding + Bullish Sentiment) → News starts to shift before positions.
Current sentiment source: AlphaVantage assessment of symbol news + average sentiment of mentioned news. The card automatically disappears for niche markets or if the sample is less than 10 articles.
🧪 Test Your Rule
A collapsible panel at the bottom of the details page that allows you to select a classic rule and view its historical performance on the same market:
- Two-Moving Average Crossover on COT Index (Briese) — Enter at percentile ≤ 20% with declining positioning, and exit at percentile ≥ 80% or after 8 weeks.
- ±3σ Breakout on z-score (Upperman) — Enter at z ≤ −3 with positive acceleration, and exit at z ≥ −1 or after 6 weeks.
- The result shows: Number of trades, Win Rate, Average Change, Profit Factor, Average Hold, Average Profit/Loss, Longest Streak.
⚠ Official CFTC Warning: Hypothetical results have inherent limitations. There is no guarantee of achieving similar profits. The rule is not optimized for a specific market — the goal is to test the idea, not to provide a trading recommendation.
🗓 Weekly Report /ar/cot/weekly
Every Friday evening after the COT analysis, a weekly report is generated that aggregates position changes across all markets on a single page. The "Weekly Report" button on the
/ar/cot main page takes you to the archive.
- Bilingual Editorial — 110-140 words (Arabic + English) summarizing the top 3 shifts of the week.
- Top Weekly Changes (Top 10) — The most active speculators.
- New Extreme Readings — Markets that have entered the ±2σ zone.
- Hot Crowding List — Markets at risk of reversal.
- Macro Regime + Institutional Flow — A risk-on/risk-off summary.
The main page /ar/cot/weekly displays the last 52 weeks, and each report
has a permalink in the format /ar/cot/weekly/YYYY-WW (e.g., 2026-17).
★ Friday Workflow
How an EL7.AI trader uses the page on CFTC release day (Friday 3:30 PM NY time):
- 4:00 PM (NY) — Open
/en/cot. Read the AI Weekly Report at the top, then the Market Summary (Bullish / Neutral / Bearish) to understand the week's sentiment. - 4:02 — Check the Top 5 Bullish and Bearish in the "Conviction Quality Filter". Is there a market in your range (GC, CL, EUR, etc.)?
- 4:04 — Open that market's page. Look at the "Conviction Quality" panel first — is the score ≥ 70? If yes, read the narrative.
- 4:06 — Scroll to "Smart · Hot · Crowd". Is one of them in a "Concentrated Whale Bet" state? Is the Crowd money biased with the Hot money (contrarian signal)?
- 4:08 — "Position Flow Matrix" — is this a new build-up or just a rollover? Which category led the move?
- 4:10 — "Concentration" — is there a sharp disparity between Long and Short? A sign of a potential breakout.
- 4:12 — "Historical Pattern Finder" — in the last N times things looked like this, what did the price do after 8 weeks?
- 4:15 — "COT & Seasonality Alignment" — does the current month support or oppose the positioning?
- 4:18 — Chart — were there recent FOMC / NFP / OPEC events explaining the shift?
- 4:20 — Decision. If yes, create a "High Conviction Quality" alert with a threshold of 75 to follow upcoming developments.
From weekly summary to decision in 20 minutes. A platform designed for the Friday trader.
★ 3 Classic COT Setups
Most traders use COT randomly — they open the report, read the numbers, and decide. The most experienced recognize specific setups that have repeated hundreds of times historically and have tested success rates. The following three setups are supported by both the COT Main Page and the Details Page directly.
1. Extreme Reading — COT Index > 90 or < 10
When the COT Index reaches historical limits (extremely overbought or oversold), the market is in a statistically unsustainable position. The longer it stays at the extreme, the higher the probability of a reversal. Rule: Extreme reading alone is not enough — it must be accompanied by a Conviction Quality score ≥ 70 on our dashboard.
2. Price-Position Divergence — Price Rises · Speculators Exit
The strongest reversal signal in the COT book. When price reaches a new high while the Net Position of Leveraged Funds (hot money) declines, this is a warning of "structural weakness" beneath the surface. It usually precedes major reversals in Gold, Oil, and indices by 2–4 weeks.
3. The First Flip — Speculators Flip After ≥ 26 Weeks
When a category of large speculators changes its direction (from Net Long to Net Short or vice versa) for the first time in 6 months or more, we call it a "statistically weighted flip." Because it indicates a real change in institutional conviction, not weekly noise. An orange badge appears automatically on the COT Main Page when "Weeks Before Flip" is ≥ 26.
⚠ Common Mistakes in Reading COT
These mistakes cost us years before we learned to avoid them. We list them here so you don't repeat them — all backed by real cases in the markets we monitor.
-
Using COT for Intraday Entry
The 3-day report delay (Tuesday → Friday) makes it a strategic tool, not a tactical one. Using it to enter a 5-minute trade is the fastest way to lose money.
Use COT to determine direction + levels, then execute entry using intraday tools (candles, volume, Order Flow). -
Reading Only One Week
A single week might be noise. The difference between a real shift and weekly volatility only appears when comparing 3–4 consecutive weeks.
On the details page, notice the historical pattern finder — it gives you a context of 13 weeks, not just one. -
Ignoring Open Interest
A change in Net Position of +50K looks huge, but if the total Open Interest is 2 million, the ratio is only 2.5%. Percentages are more honest than absolute numbers.
Always look at the "% of Total Change" column in the position flow matrix before interpreting any number. -
Confusing Dealer in Forex vs. Commodities
In the TFF report (Forex), Dealer = large commercial banks and often represents the opposite side of speculators. In Disaggregated (Commodities), the corresponding category is Producer/Merchant (actual producers). Same concept, different names.
Review the Glossary at the bottom of this guide to know the categories for each report. -
Focusing on "Net Position" Without Looking at Concentration
Bullish net position with high concentration on the other side = a fragile setup, prone to a sudden breakout. Speculators might cover their positions in one week, reversing the market.
The "Concentration and Breakout Risk" panel gives a direct reading — use it before any decision. -
Reading COT in Isolation from Seasonality
Extreme long positioning in a historically bearish month = a reversal setup. Ignoring seasonality makes you buy at tops and sell at bottoms.
The "COT Alignment with Seasonality" section gives you a 4-slot verdict: Bullish Alignment / Bearish Alignment / Reversal Setup / No Alignment. -
Over-trading Markets — "COT Everything"
50+ markets, 5 releases per month = endless noise. The most successful traders focus on only 3–5 markets and master every detail of them.
Sort the quality filter descending, choose only the top 3, and ignore the rest until the following week.
📖 Glossary of Terms (AR/EN)
All technical terms appearing in CFTC reports and on EL7.AI pages, arranged alphabetically with a brief meaning in English.
Trader Categories
| Term | Meaning |
|---|---|
| Commercial | Commodity producers + industrial users + hedging banks. Usually counter-trend — buying at bottoms, selling at tops. |
| Non-Commercial | Large speculators: hedge funds + CTAs + Managed Money. They follow the trend. |
| Non-Reportable | Small traders below the mandatory reporting threshold. Used as a contrarian indicator. |
| Reportable | Every trader holding positions above the official threshold who reports their status daily to the CFTC. |
| Dealer (DI) | In the TFF report: Commercial banks and market makers. They play the Commercial role in Forex. |
| Asset Manager (AM) | In TFF: Investment management companies, pension funds. Institutional hedgers. |
| Leveraged Funds (LM) | In TFF: Hedge funds + CTAs. The most influential speculators. |
| Producer/Merchant (PM) | In Disaggregated (commodities): Physical oil, mining, and agricultural companies. |
| Swap Dealer (SD) | In Disaggregated: Banks hedging positions for ETFs and structured products. |
| Managed Money (MM) | In Disaggregated: The equivalent of Leveraged Funds — hedge funds in commodities. |
Indicators & Metrics
| Term | Meaning |
|---|---|
| COT Index | Repositioning of Net Position on a 0–100 scale over 156 weeks. >80 = extreme buying, <20 = extreme selling. |
| Z-Score | Number of standard deviations away from the annual average. >2σ = extreme reading. |
| Net Position | Long minus Short for a specific category. Positive = Net Long, negative = Net Short. |
| Open Interest (OI) | Total live contracts in the market (Long = Short). Measures total interest. |
| Concentration | The share of the largest 4 or 8 traders of the Open Interest on a specific side. |
| Divergence | Price moving in one direction while not confirmed by speculator positioning. |
| Position Flip | A shift in a category's Net Position from Long to Short or vice versa. |
| Traders in Financial Futures | Specific classification for financial contracts (Forex, Indices, Bonds, Crypto). |
| Disaggregated Report | Specific classification for commodity contracts (Gold, Oil, Agriculture). |
| Legacy Report | The original format with only two categories: Commercial and Non-Commercial. |
| Supplemental (CIT) | Addition of Commodity Index Traders to the standard agricultural report. |
| Conviction Quality | EL7.AI's proprietary score (0–100) measuring "whether the extreme reading is real or noise." |
🧮 Calculation Methodology and Limitations
Full transparency on how we calculate the numbers you see — and where the data limits lie.
Conviction Quality Score Formula
Score from 0 to 100 = sum of five components, each component from 0 to 20:
- Signal Magnitude — The absolute annual Z-Score of the Net Position for the primary category (Managed Money or Leveraged Funds depending on the report type).
- Directional Purity — Is the change a single push (high purity) or weekly fluctuation (low purity)?
- Concentration — Distribution of positions across the number of reportables. Low concentration = more robust signal.
- Reporting Coverage — The ratio of officially reported positions to the total Open Interest.
- Participation — Activity volume compared to the 52-week average.
Historical Calculation Windows
- Z-Score: 52-week window — balancing responsiveness to recent shifts with statistical stability.
- COT Index: 156-week window (3 years) — reading the historical positioning.
- Historical Patterns (Analogs): Cosine similarity model on 156-week windows.
- Seasonality: Average monthly performance over the last 10 years for each market.
Data Sample and Limitations
- Coverage includes US futures markets only (CME · ICE · NYMEX · CBOT · COMEX). It does not include spot markets directly.
- Crypto is limited to regulated CME contracts (BTC, MBT, ETH, MET) — it does not cover the spot market or Tier 2/3 exchanges.
- Minor metals and rare agricultural commodities may have a sample size of less than 52 weeks — in this case, we hide additional statistics cards.
- Data prior to 2014 is limited for detailed reports (Disaggregated/TFF) — they were officially introduced that year. Legacy data is available back to 1986.
What We Do Not Provide
- We do not issue direct trading recommendations or specific entry/exit levels.
- We do not forecast prices — we summarize positioning and analyze its historical context only.
- We do not cover CFTC reports on micro metals (such as MGC) if they do not have sufficient liquidity in the official report.
🎟 What is available in each plan?
A quick matrix showing which features are available to everyone, and which are unlocked for subscribers.
| Feature | Free Plan | Subscribers |
|---|---|---|
Weekly reading of the homepage /ar/cot | Limited Preview | Full |
| Conviction Quality Filter (Top 10) | Partial | Full |
| Detail pages for each market | Preview | Full |
| AI Weekly Report | No | Yes |
Custom Alerts /ar/cot/alerts | No | Yes |
| Rule Backtester | No | Yes |
| API Interface + CSV Export | No | Yes |
Availability is subject to change. To see the current status, check the Pricing Page.
❓ Frequently Asked Questions
Ten common questions we receive from traders — compiled from support and organic search. Each answer is short, practical, and linked to the relevant product page.
What is the COT report and who issues it?
The COT (Commitments of Traders) report is a weekly report issued by the US CFTC every Friday at 3:30 PM New York time. It shows the actual positioning of each category of traders in the US futures markets — from banks and producers to hedge funds and retail traders.
Exactly when is the COT report released?
Every Friday at 3:30 PM New York time (20:30 UTC in winter, 19:30 UTC in summer). The data reflects Tuesday's closing positions — meaning an inherent 3-day lag. EL7.AI updates COT pages automatically within 10–15 minutes of the official release.
What is the difference between Legacy, TFF, Disaggregated, and Supplemental reports?
Legacy is the traditional report with two categories (Commercials + Non-Commercials) and covers all markets. TFF (Traders in Financial Futures) breaks down the financial side into Dealer / Asset Manager / Leveraged Funds / Other Reportables — and is used for Forex, Indices, and Bonds. Disaggregated breaks down commodity contracts into Producer/Merchant, Swap Dealer, Managed Money, and Other Reportables. Supplemental (CIT) adds the Index Traders category for agricultural commodities only.
Is the COT report suitable for Crypto?
Yes, for BTC and ETH futures on the CME (symbols BTC and MBT for Bitcoin, ETH and MET for Ethereum). However, it does not cover the spot market or deposits in decentralized exchanges. It is used as a signal for the positioning of major institutions (Asset Managers and Leveraged Funds) rather than total crypto supply and demand.
What is the difference between Smart Money and Hot Money?
Smart Money = Commercials (Producers, Banks, and industrial hedgers). They buy at the bottom and sell at the top because they actually use the commodity and have a long horizon. Hot Money = Hedge funds and large speculators. They follow the trend and reach extremes at peaks, making them vulnerable to reversals during major shifts. The strongest signal: when Smart Money and Hot Money are positioned in opposite directions at extremes.
What is the COT Index and when is it considered extreme?
The COT Index re-positions the Net Position of each category on a scale of 0–100 over a 156-week (3-year) window. Readings above 80 = historically overbought, below 20 = oversold. Readings > 90 or < 10 are considered extreme and worth attention. However: an extreme reading alone is not enough — it must be accompanied by a high conviction quality score (see Section 7).
Do I use COT for intraday trade entries?
No. COT is weekly data with a 3-day lag, not suitable for tactical entry. Use it to determine the overall trend and extreme readings, then execute entries using intraday technical tools (levels, candles, volume, Order Flow). Ignoring this rule usually leads to poorly founded decisions.
What is meant by "COT Divergence"?
It occurs when the price moves in one direction and is not confirmed by speculator positioning — for example, the price rises to a new high while the Net Position of Leveraged Funds declines. Historically, this pattern precedes major reversals in Gold, Oil, and Indices by 2–4 weeks. EL7.AI displays a "Divergence Alert" badge automatically when the pattern forms on any market page.
How do I interpret high concentration on one side?
If the share of the top 4 traders in buying or selling exceeds 40%, the market is fragile on that side. Any strong opposing price movement may force whales to cover quickly, doubling the move (breakout risk). The two cards side-by-side on the details page give you a direct comparison, and the integrated judgment at the bottom identifies the likely breakout side.
Is COT data available as an API on EL7.AI?
Yes. A unified endpoint:
GET /api/cot/markets/{cftcCode}/fullReturns everything shown on the details page in a single request (JSON or CSV via the ?format=csv parameter), with 35 fields including the quality panel, flow, concentration, patterns, seasonality, and macro events. Example for the EUR/USD page:
curl https://el7.ai/api/cot/markets/099741/full | jq .📚 Further Reading
If you want to dive deeper after mastering the EL7.AI course, these are the most important globally recognized academic and practical sources in COT analysis — ordered from most practical to most theoretical.
- Official Reports on CFTC.gov All four reports (Legacy · TFF · Disaggregated · Supplemental) as xls, txt, and xml files. Updated every Friday after 3:30 PM NY.
- Trade Stocks & Commodities with the Insiders — Larry Williams The original reference for COT strategies. Williams is the one who popularized the COT Index as a statistical indicator.
- The Commitments of Traders Bible — Stephen Briese The most detailed in interpreting categories and shifts. Particularly important for commodities.
- Short-Side Long — Jason Shapiro Shapiro is one of the most successful contemporary COT traders, known via Real Vision. His approach focuses on extreme readings + concentration.
- Commitments of Traders — Wikipedia (English) Overview of the report's history, legislative changes, and academic critiques.